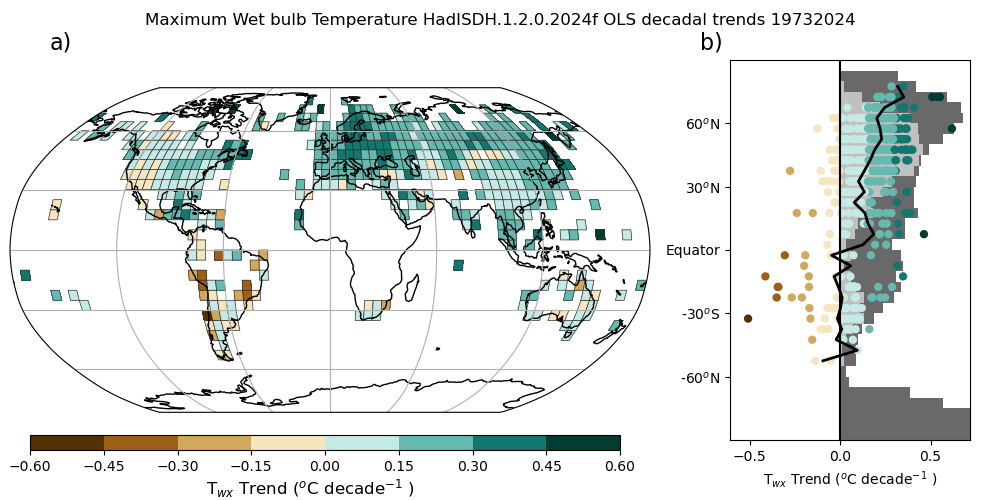
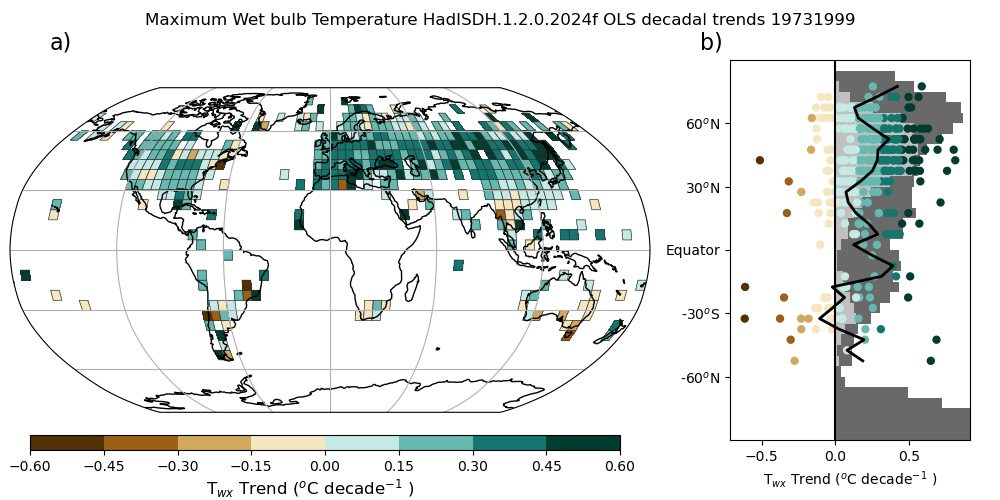
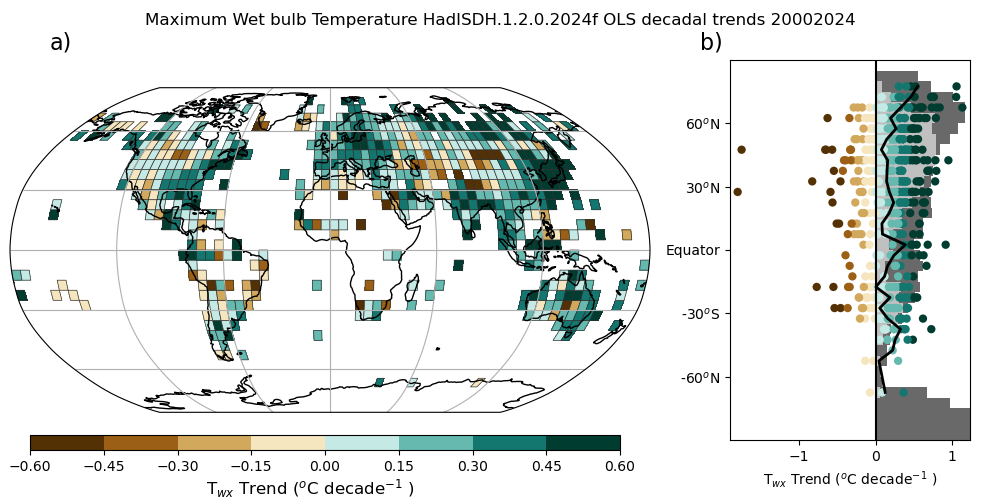
Monthly maximum of daily maximum wet bulb temperature (TwX) anomaly (1991-2020)
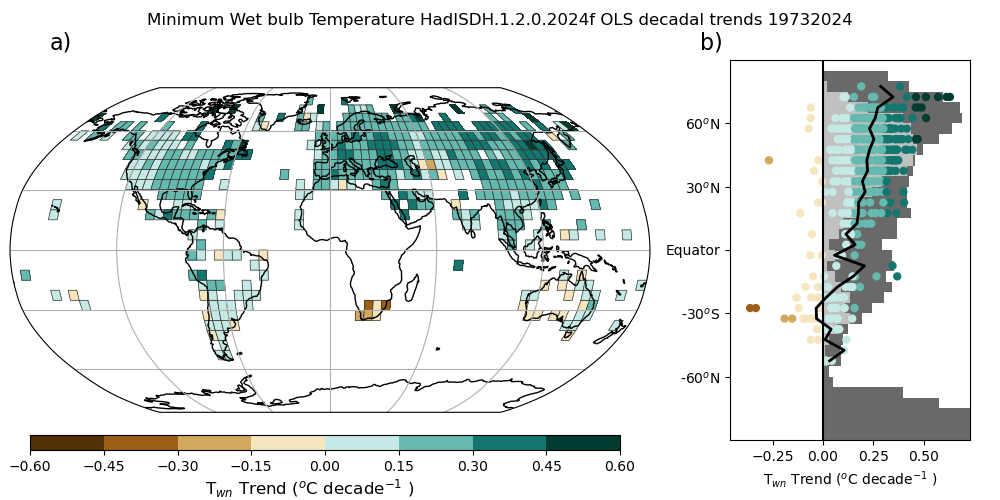
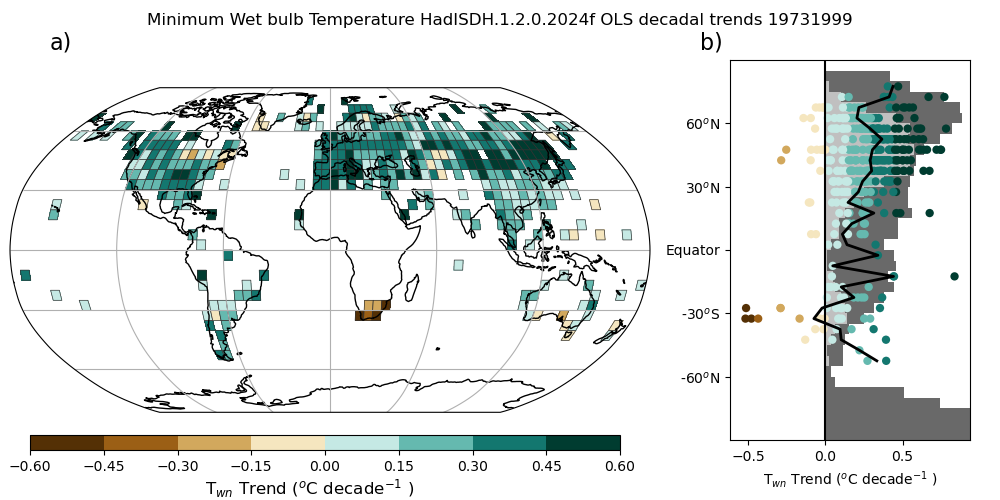
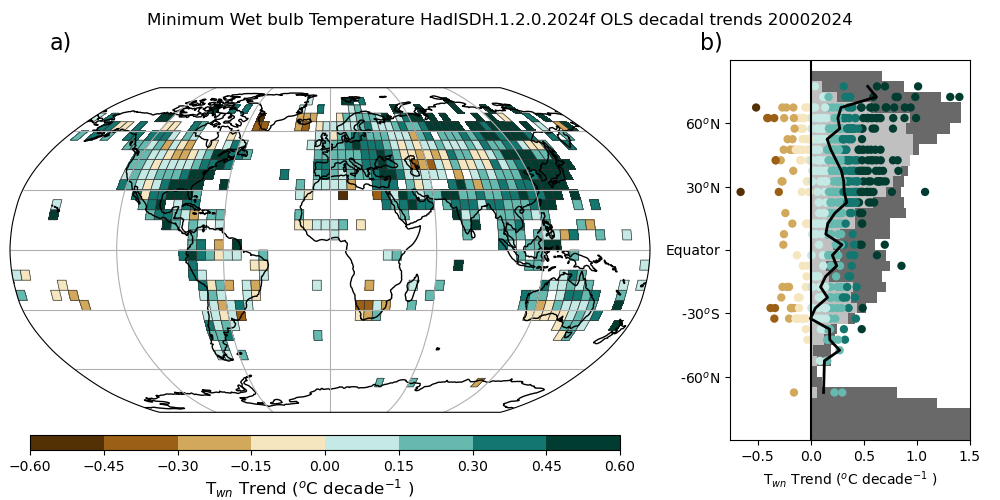
Monthly minimum of daily minimum wet bulb temperature (TwN) anomaly (1991-2020)
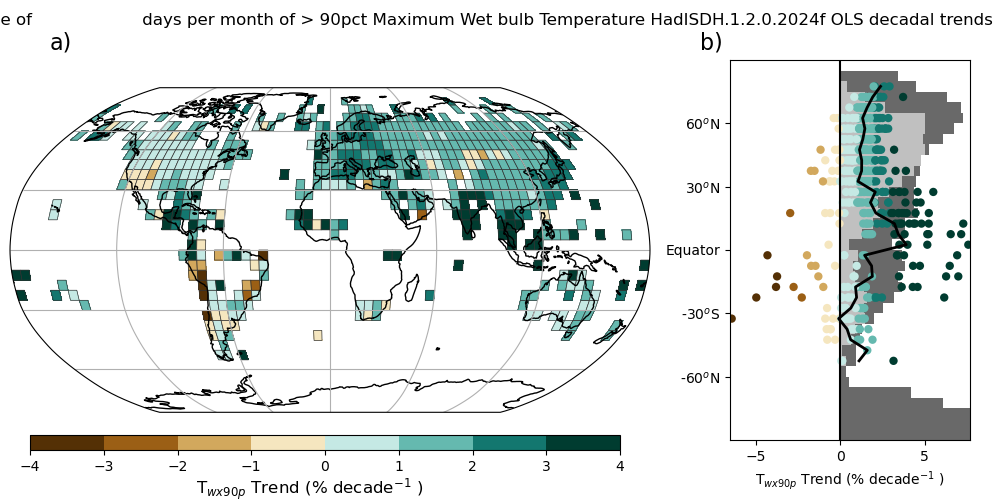
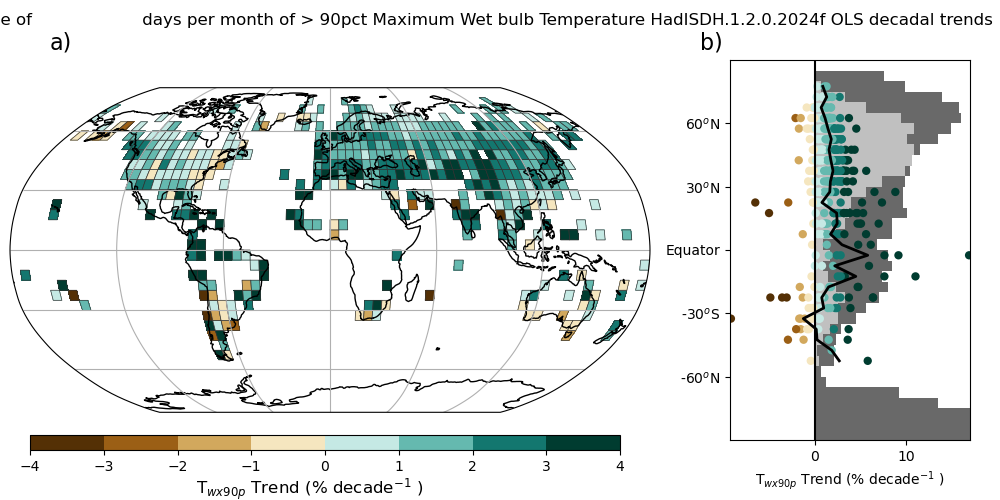
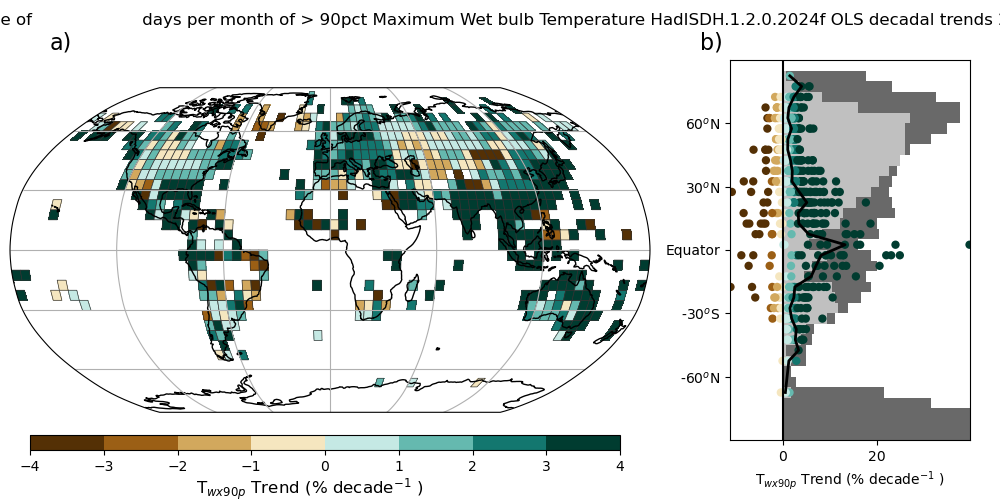
Percentage of days per month exceeding 90th percentile of climatological daily maximum wet bulb temperature (TwX90p) anomaly (1991-2020)
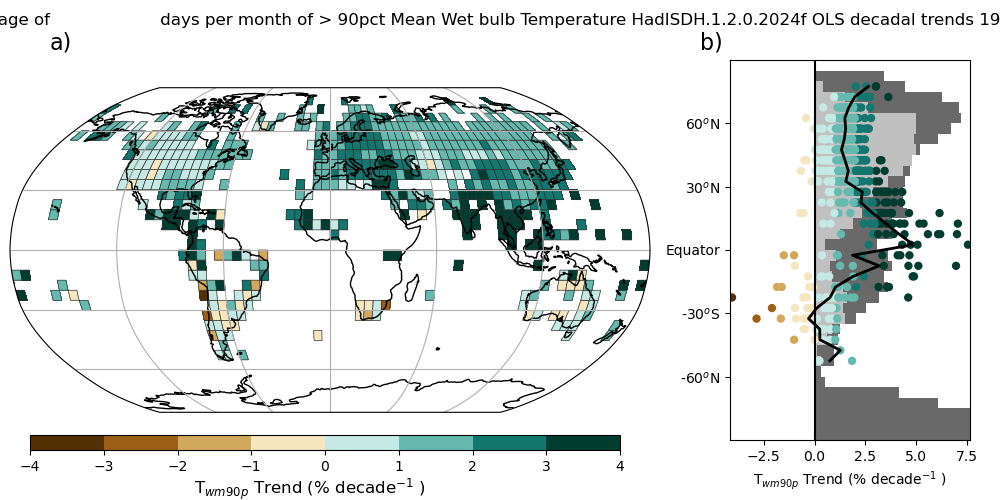
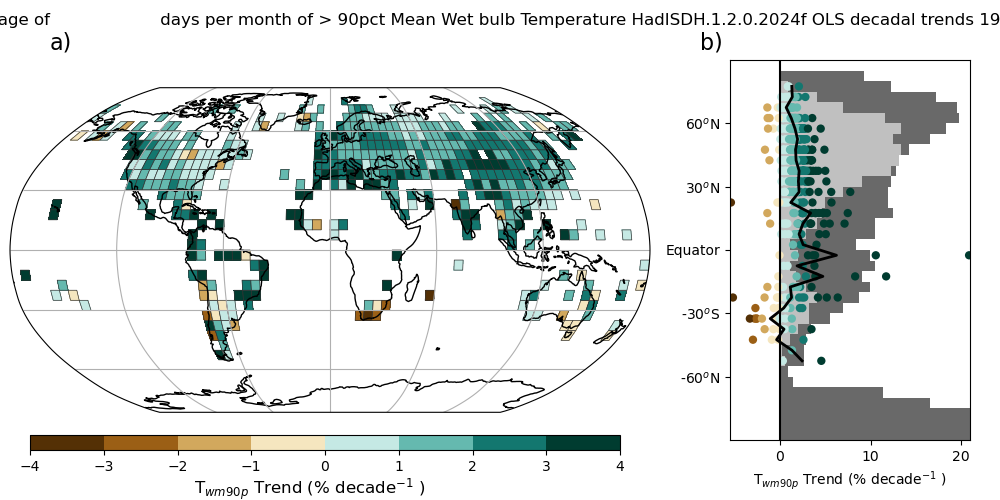
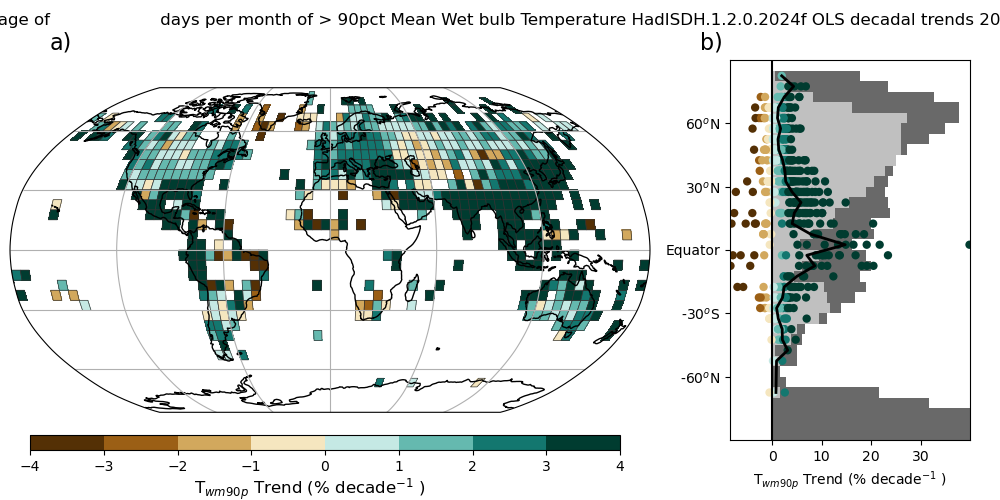
Percentage of days per month exceeding 90th percentile of climatological daily mean wet bulb temperature (TwM90p) anomaly (1991-2020)
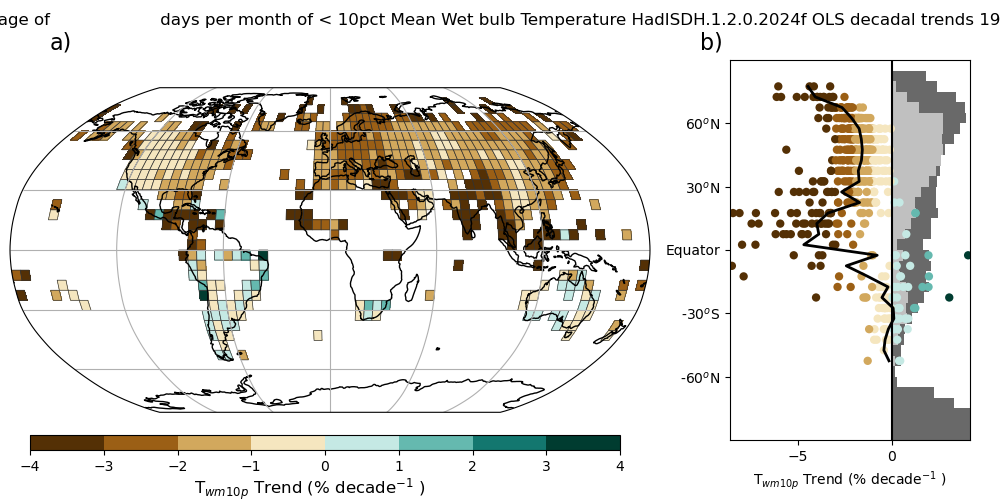
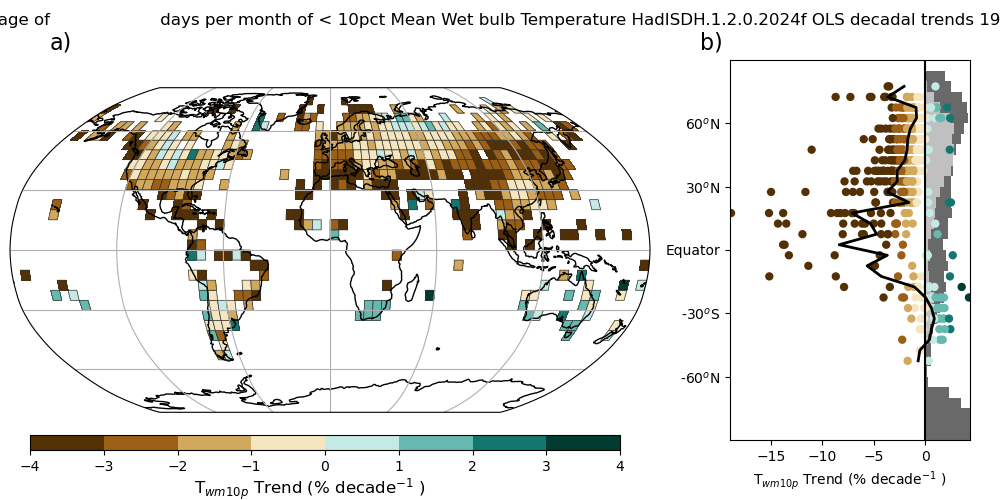
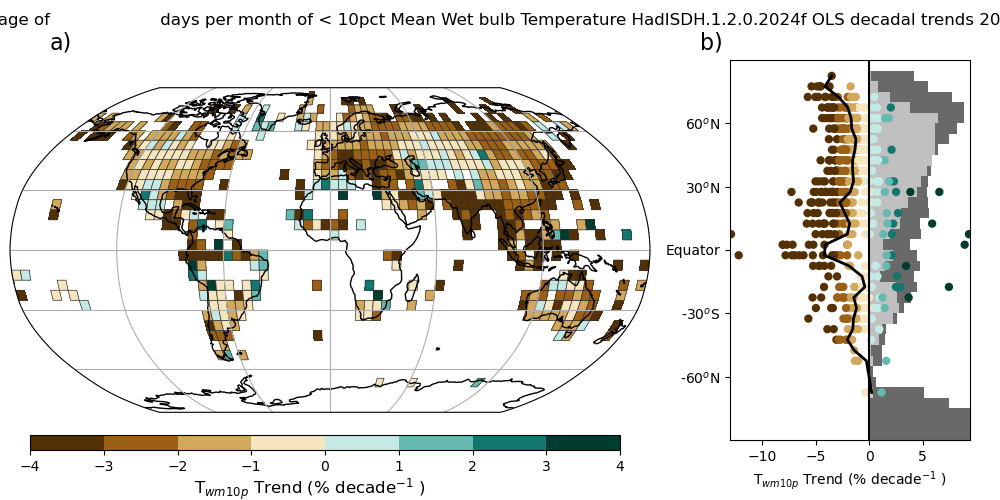
Percentage of days per month exceeding 10th percentile of climatological daily mean wet bulb temperature (TwM10p) anomaly (1991-2020)
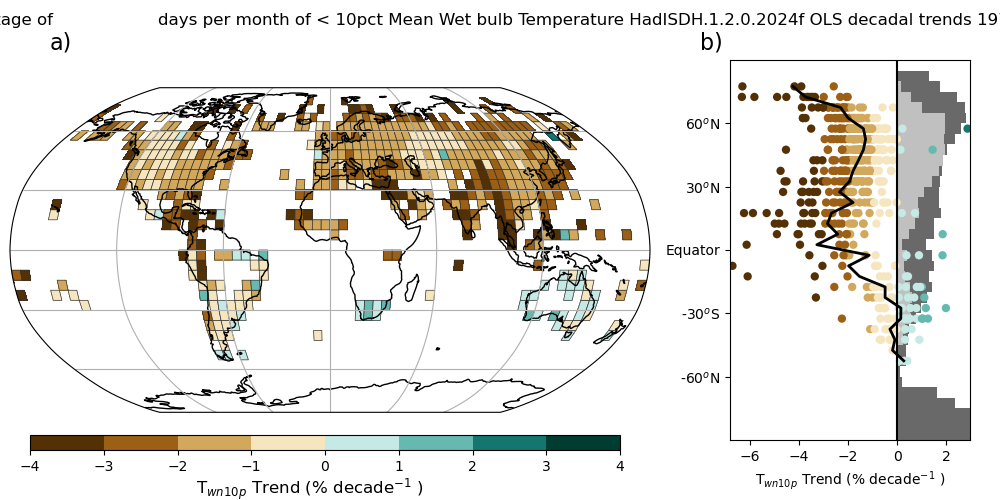
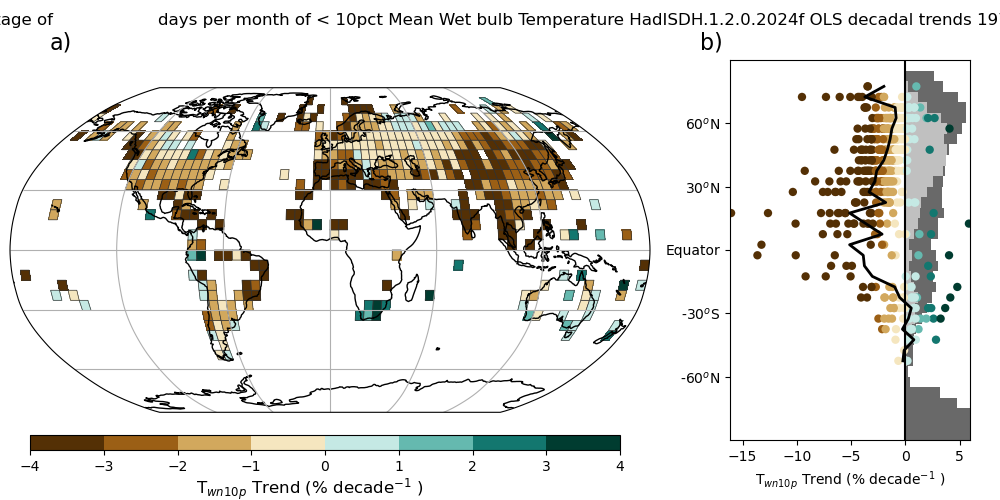
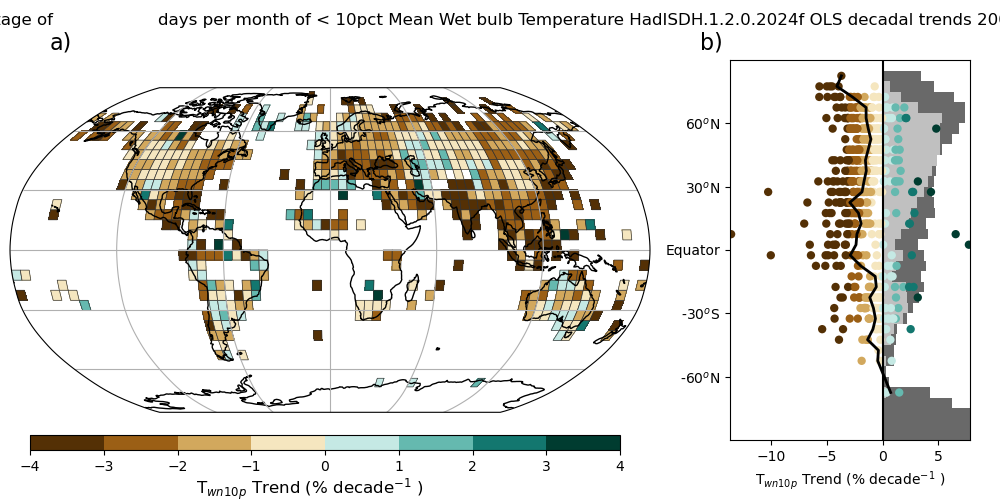
Percentage of days per month exceeding 10th percentile of climatological daily minimum wet bulb temperature (TwN10p) anomaly (1991-2020)
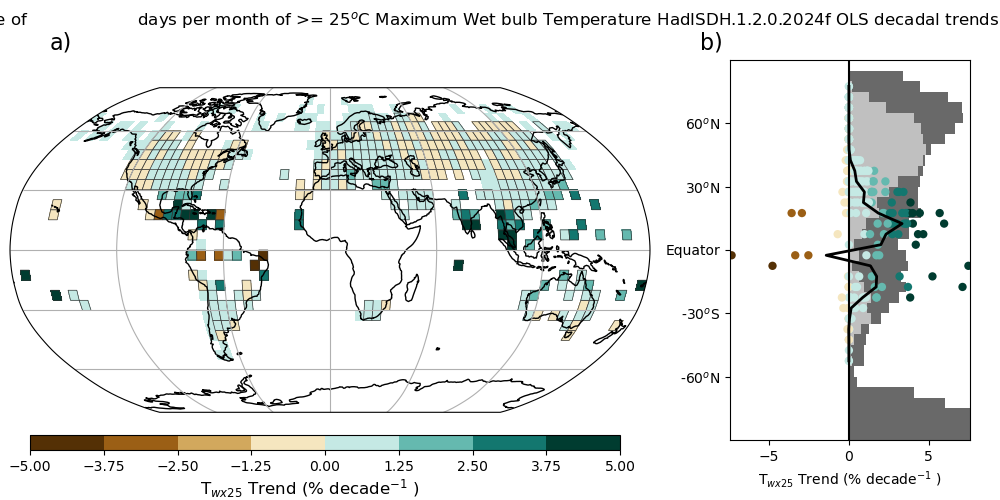
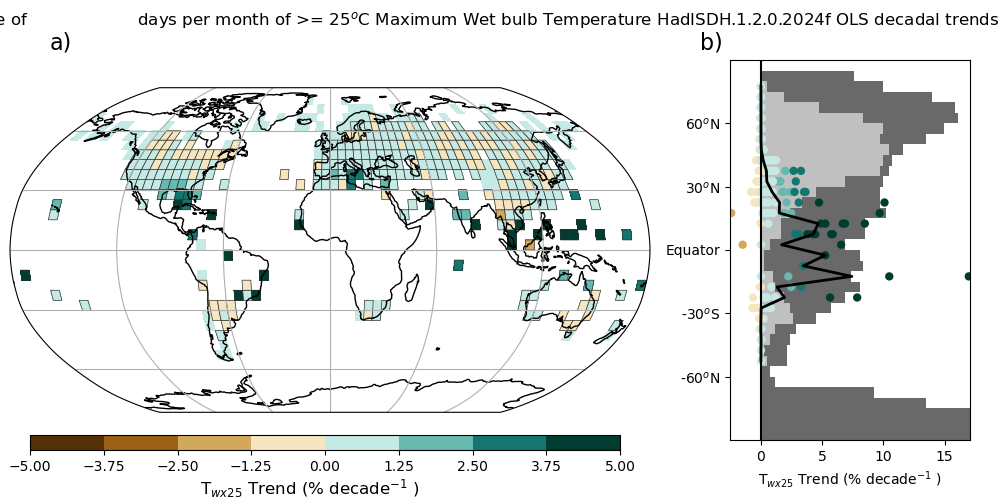
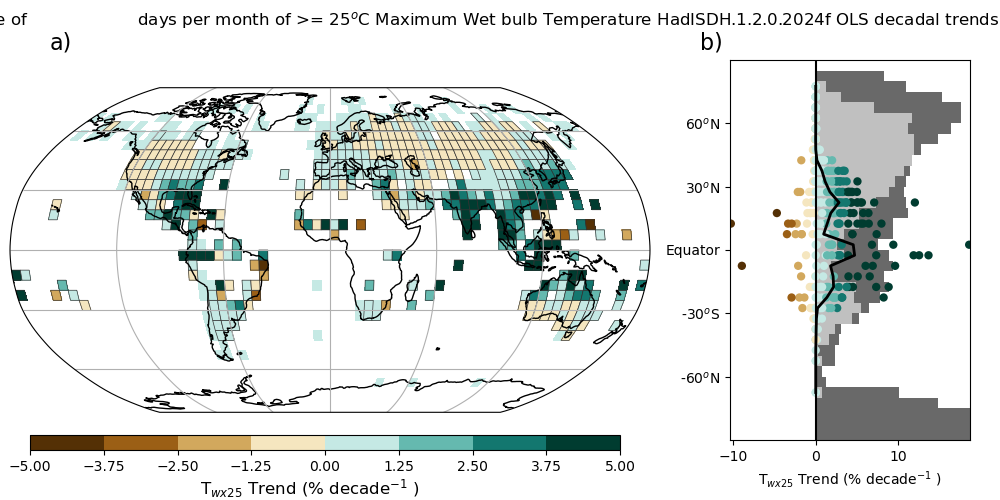
Percentage of days per month equal or exceeding 25 °C maximum wet bulb temperature (TwX25) anomaly (1991-2020)
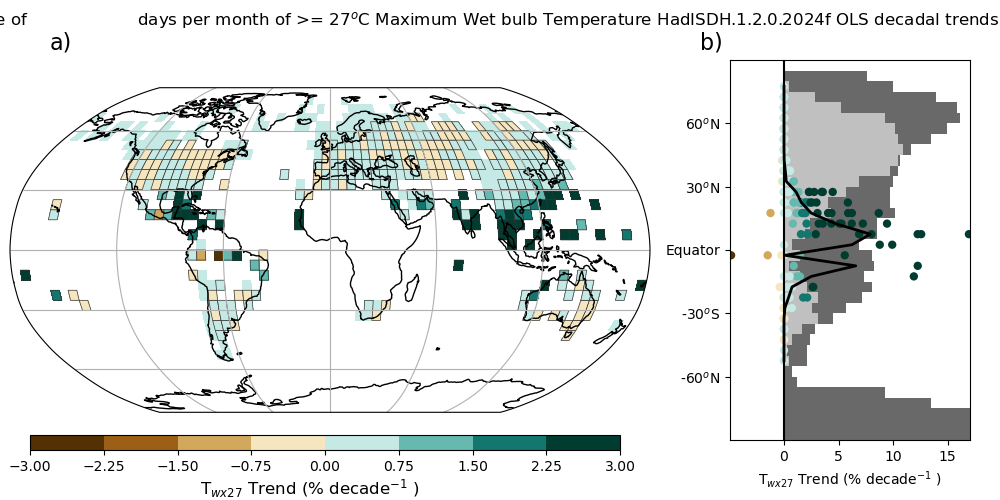
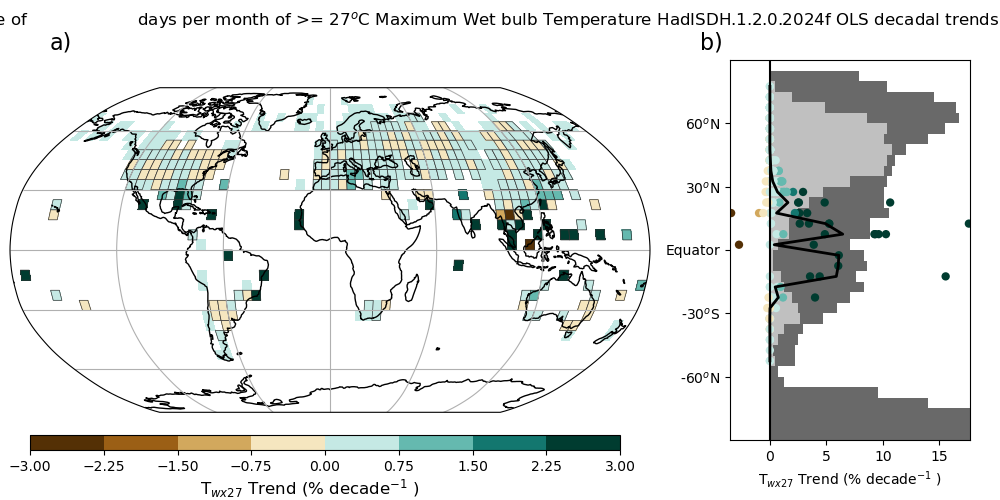
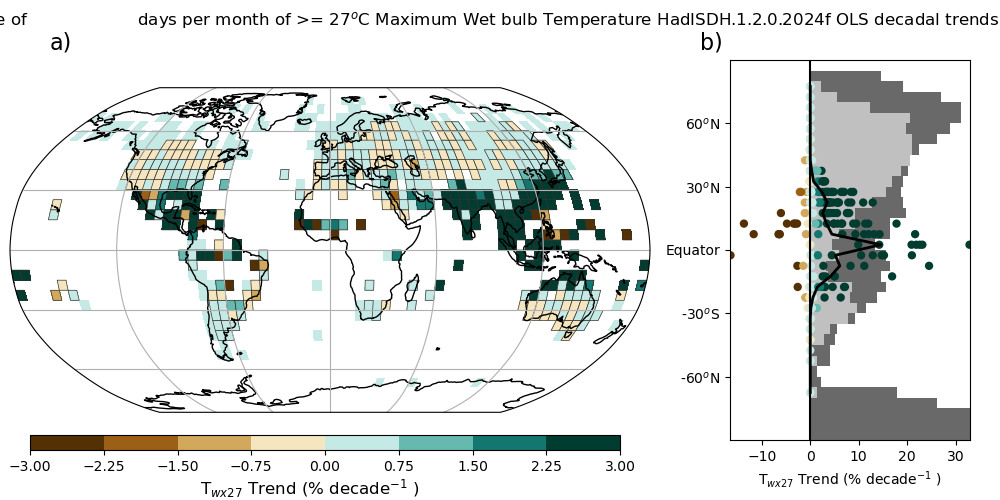
Percentage of days per month equal or exceeding 27 °C maximum wet bulb temperature (TwX27) anomaly (1991-2020)
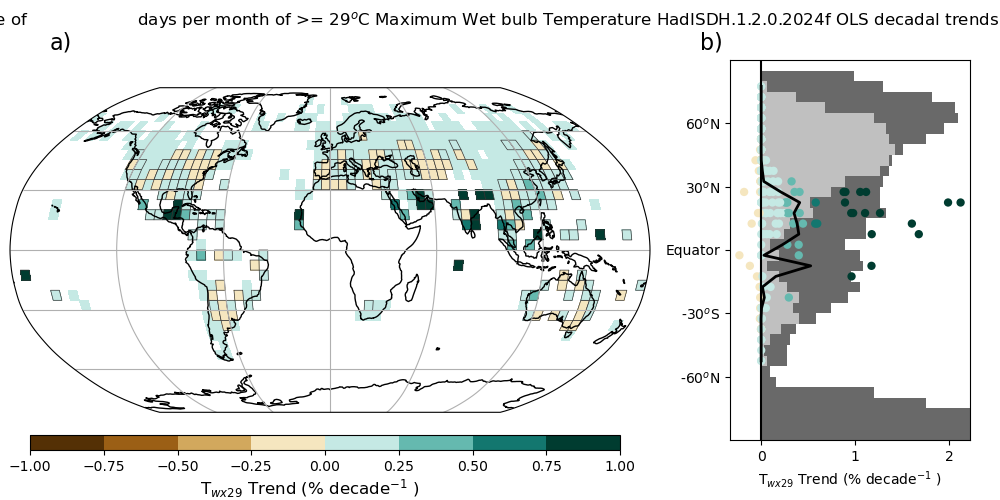
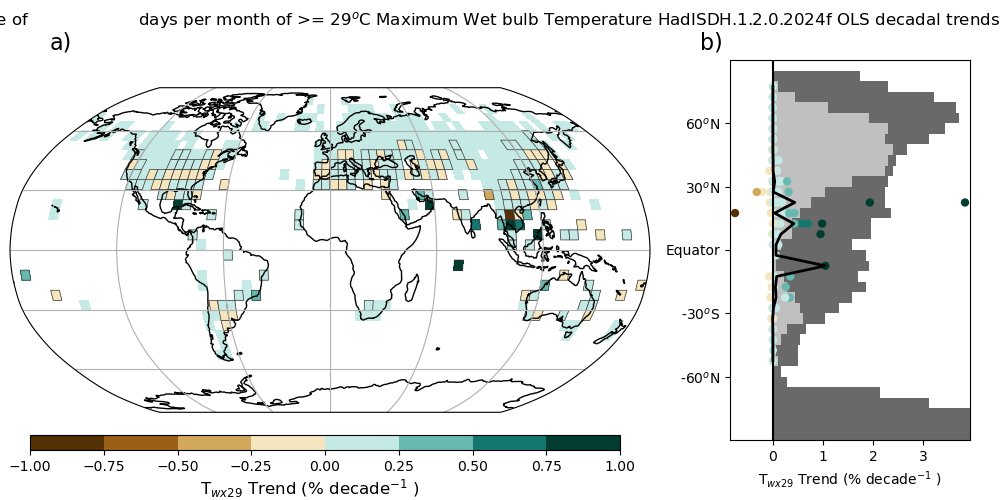
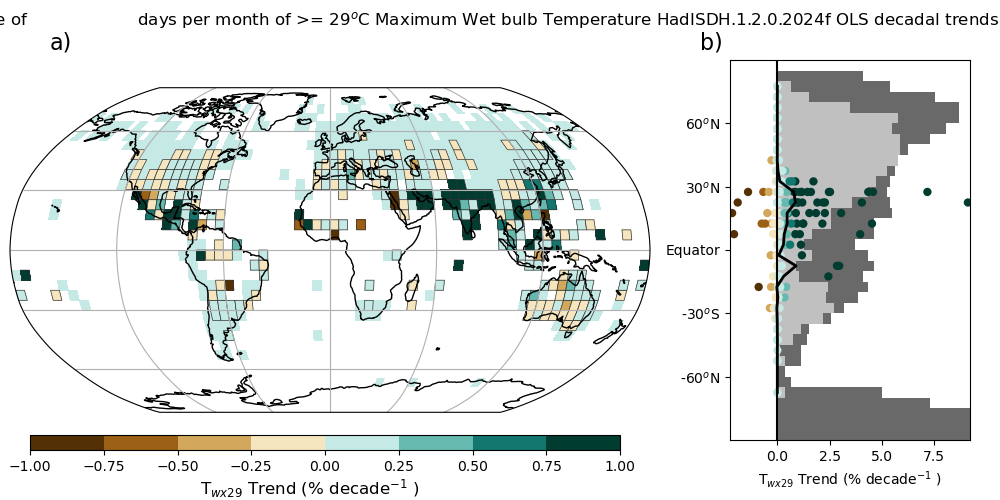
Percentage of days per month equal or exceeding 29 °C maximum wet bulb temperature (TwX29) anomaly (1991-2020)
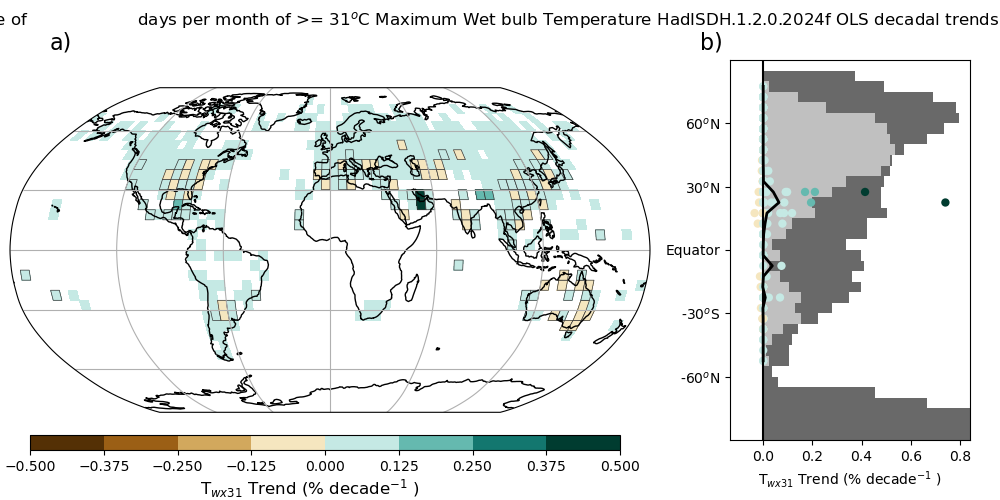
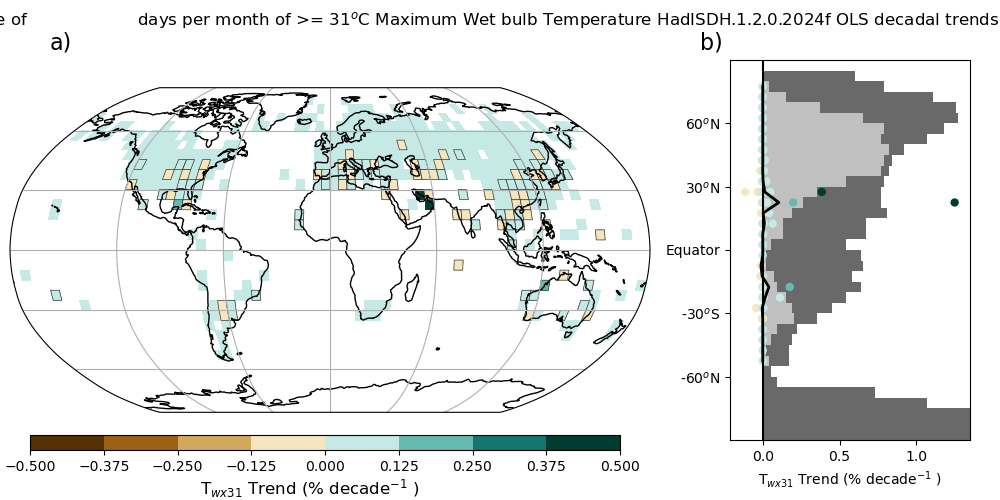
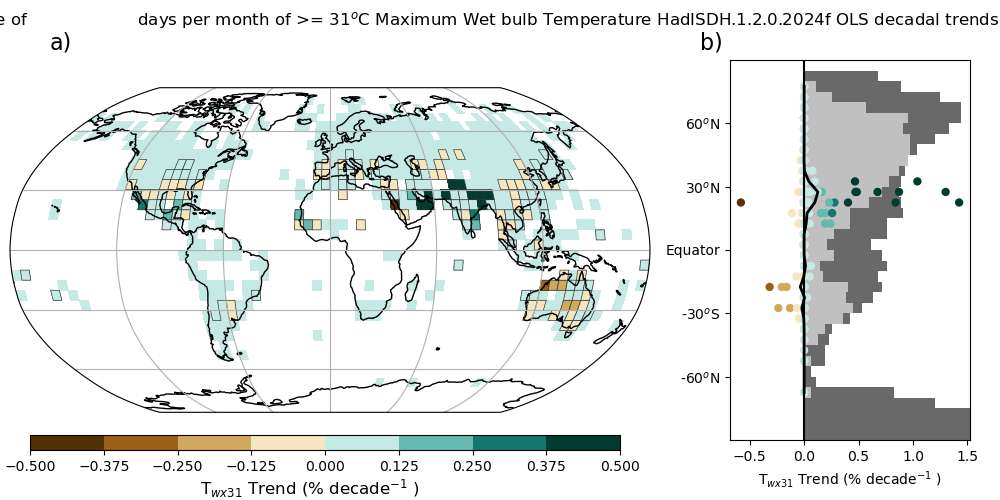
Percentage of days per month equal or exceeding 31 °C maximum wet bulb temperature (TwX31) anomaly (1991-2020)
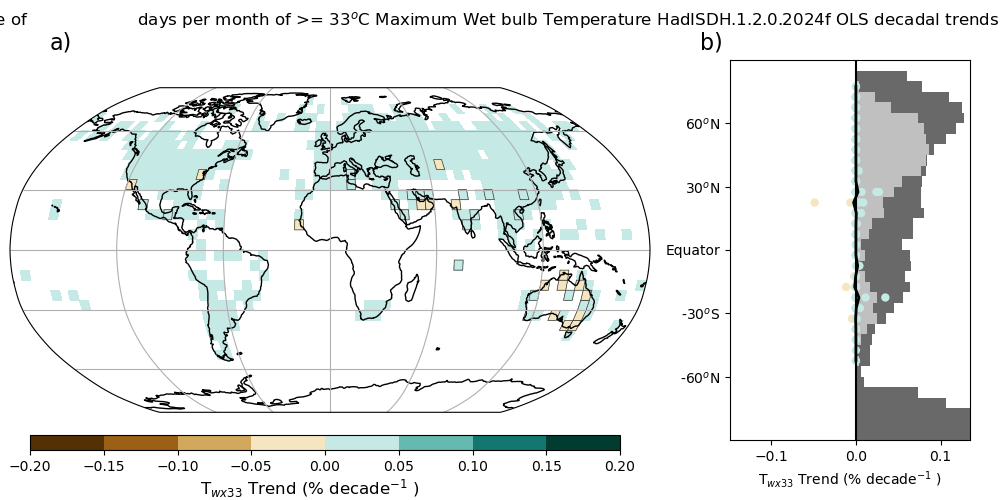
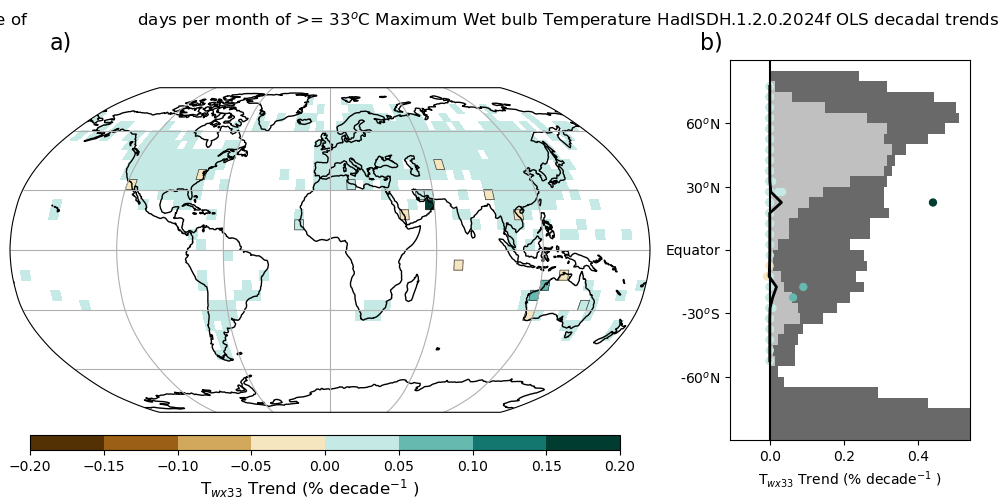
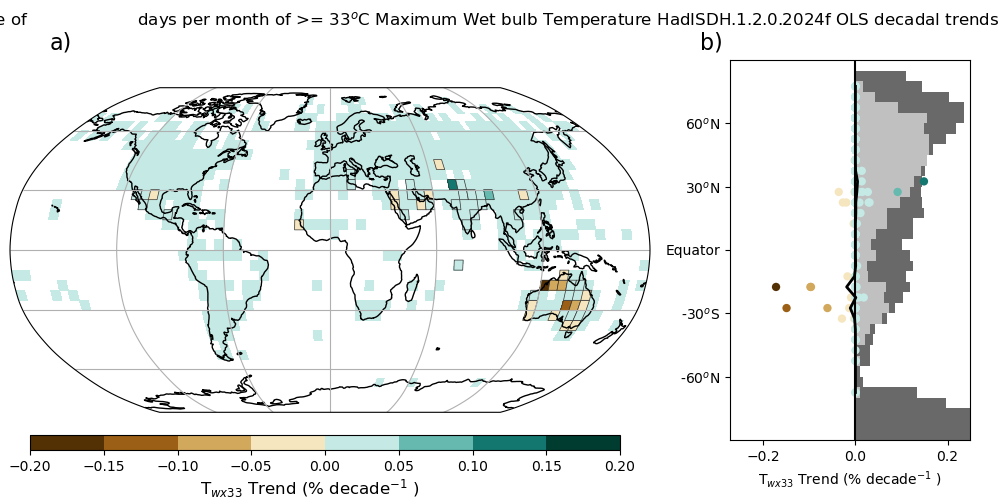
Percentage of days per month equal or exceeding 33 °C maximum wet bulb temperature (TwX33) anomaly (1991-2020)
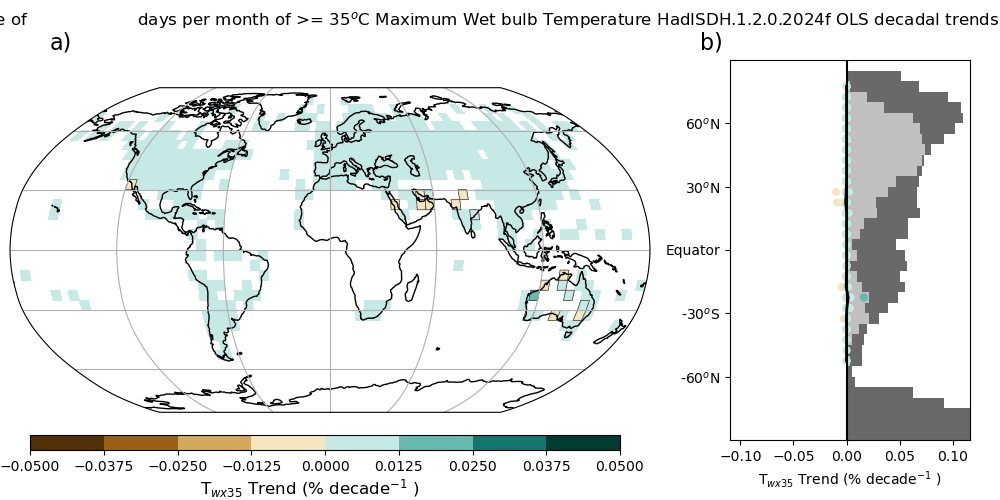
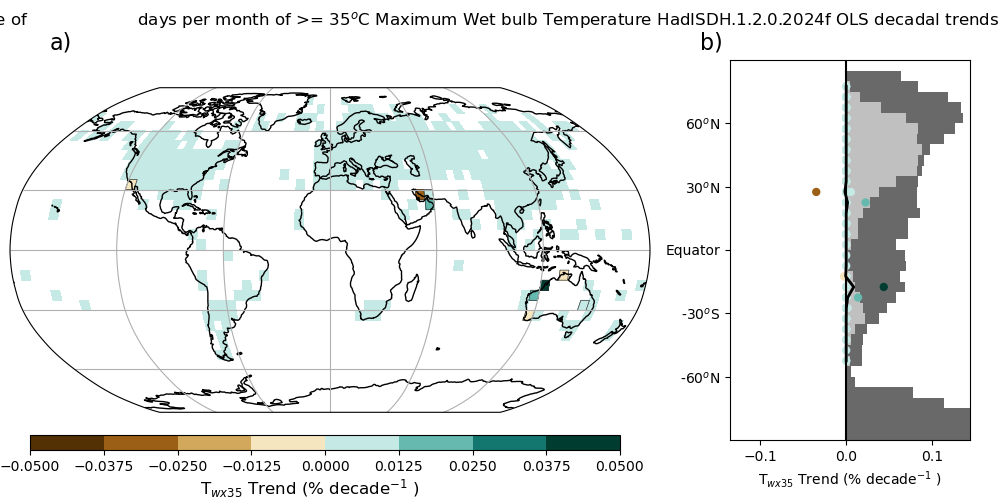
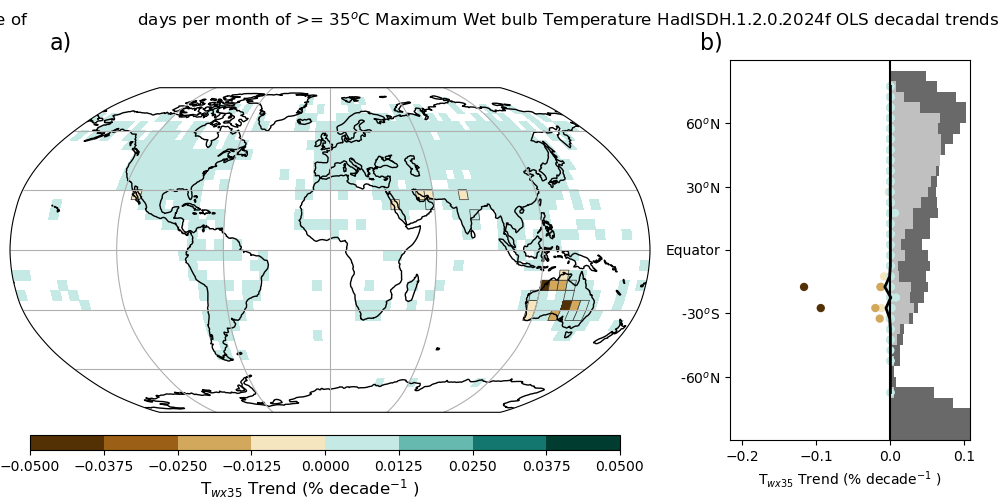
Percentage of days per month equal or exceeding 35 °C maximum wet bulb temperature (TwX35) anomaly (1991-2020)
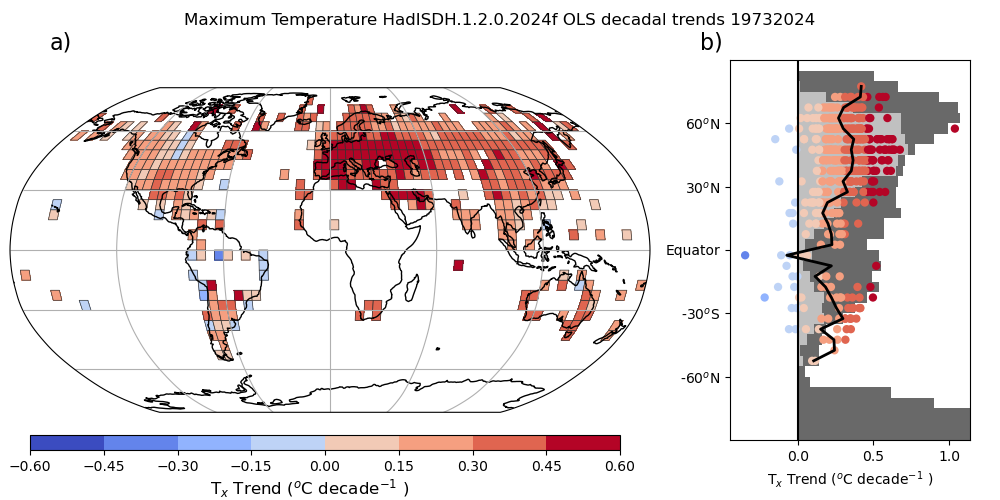
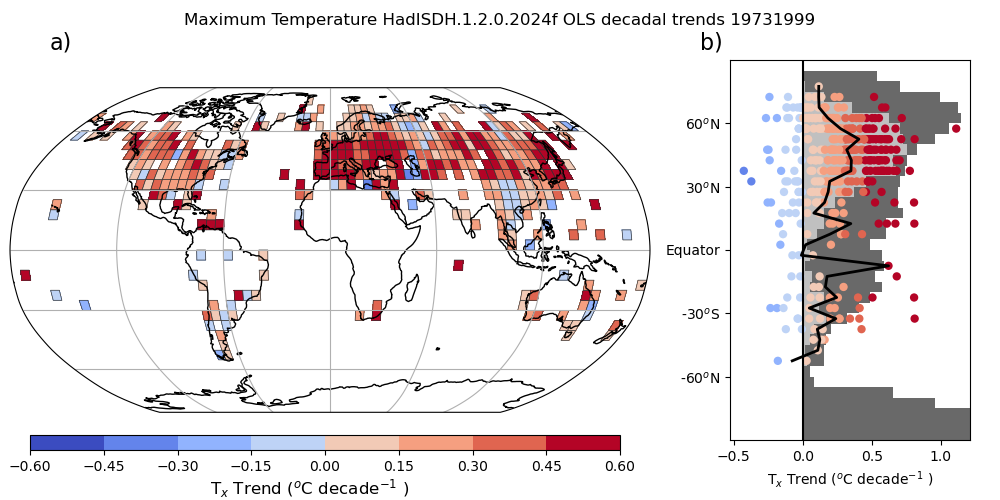
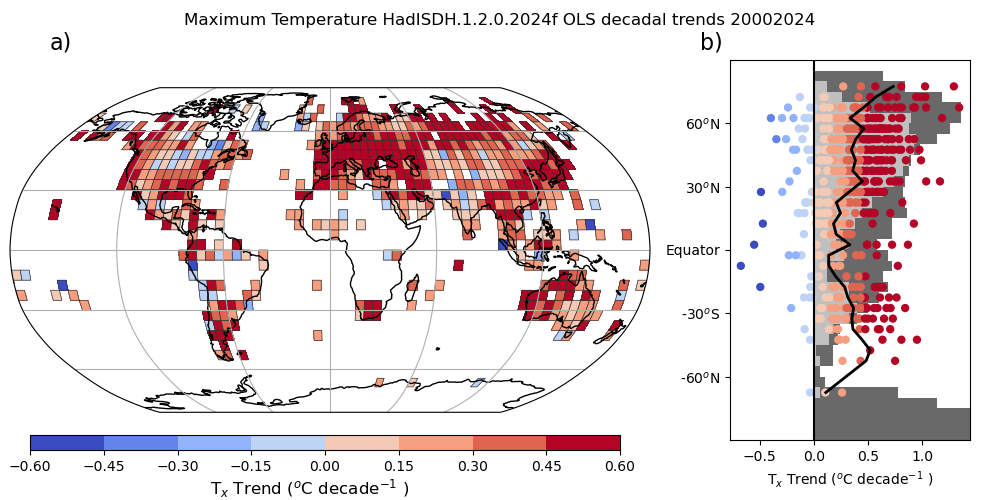
Monthly maximum of daily maximum dry bulb temperature (TX) anomaly (1991-2020)
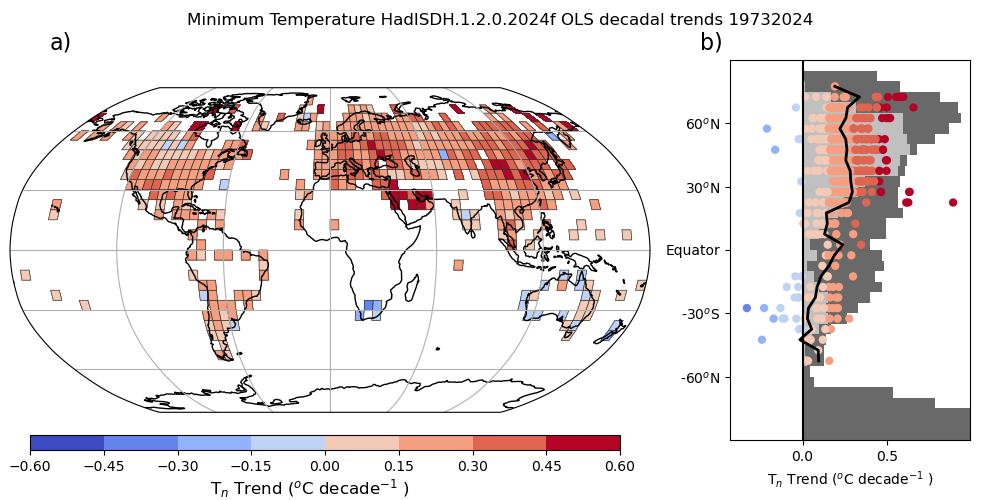
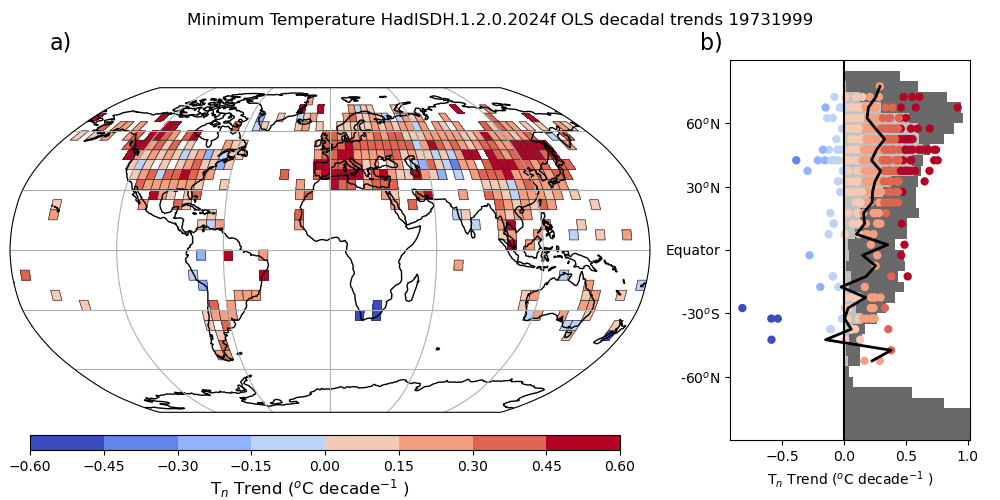
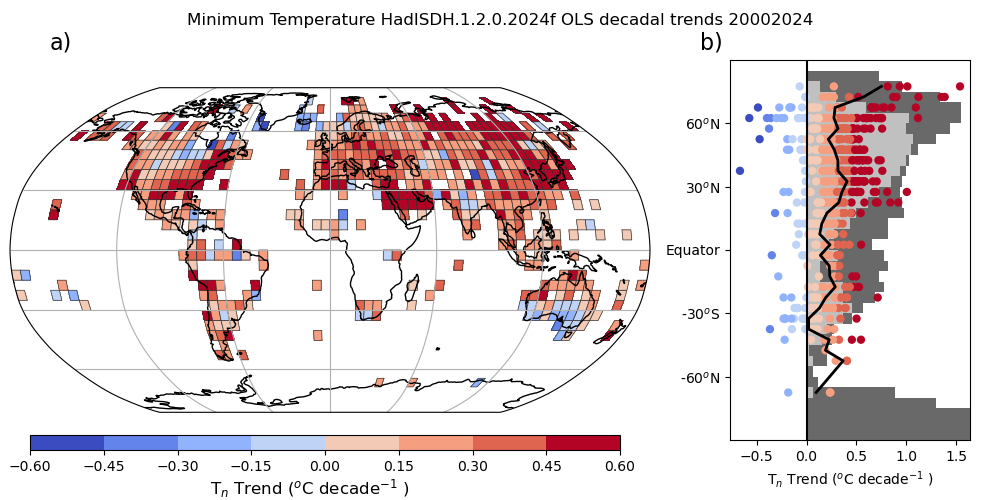
Monthly minimum of daily minimum dry bulb temperature (TN) anomaly (1991-2020)
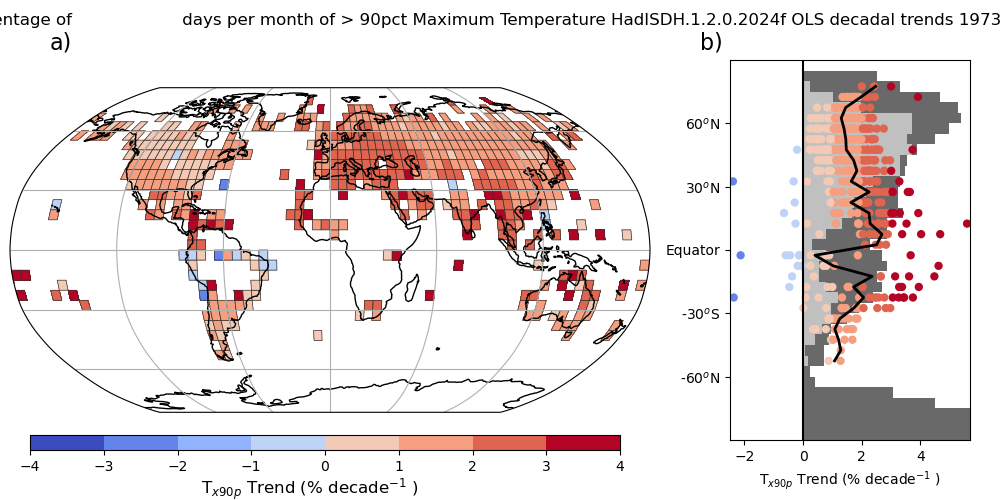
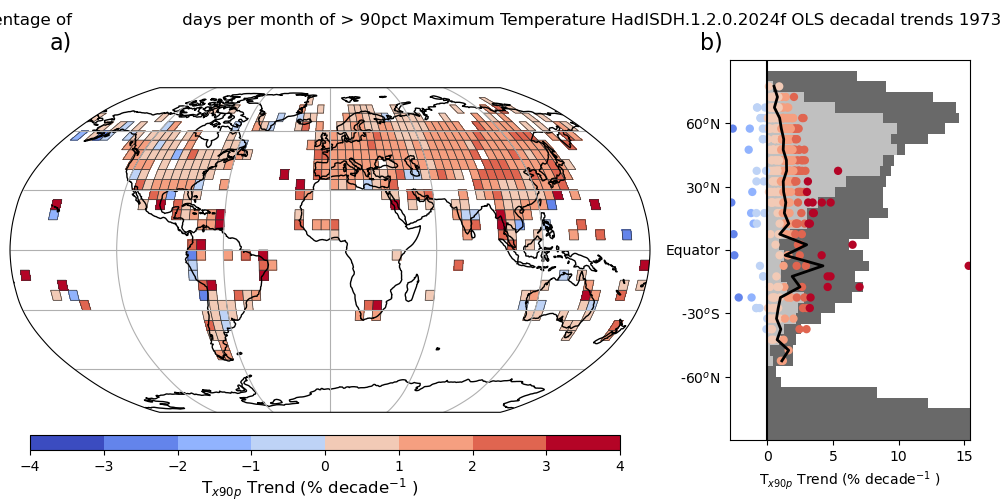
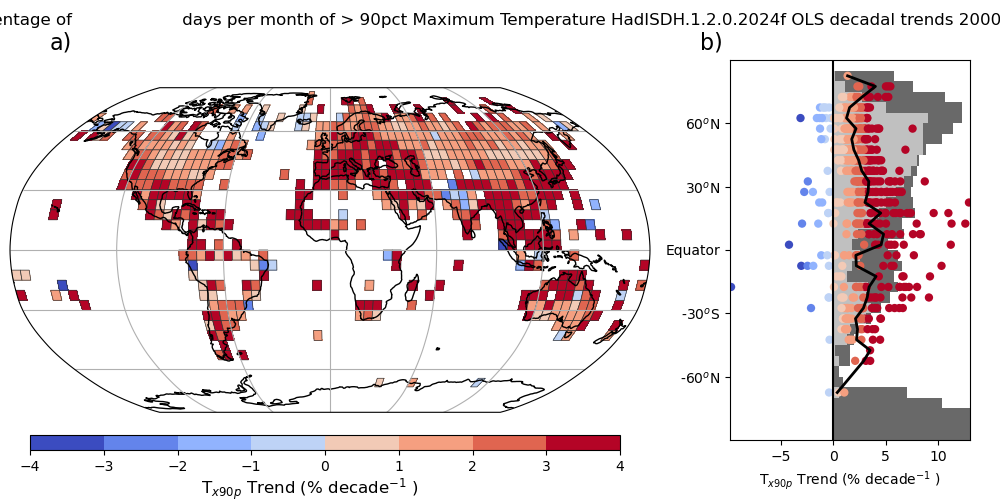
Percentage of days per month exceeding 90th percentile of climatological daily maximum dry bulb temperature (TX90p) anomaly (1991-2020)
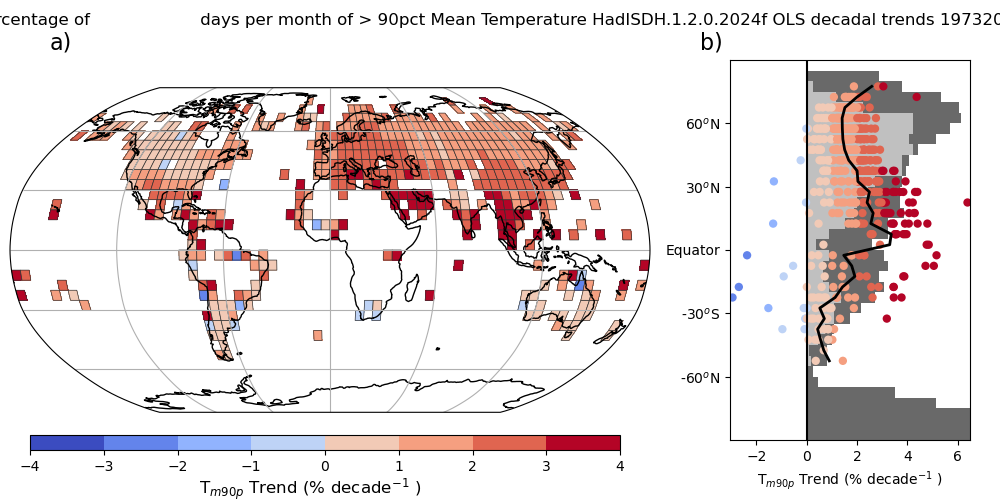
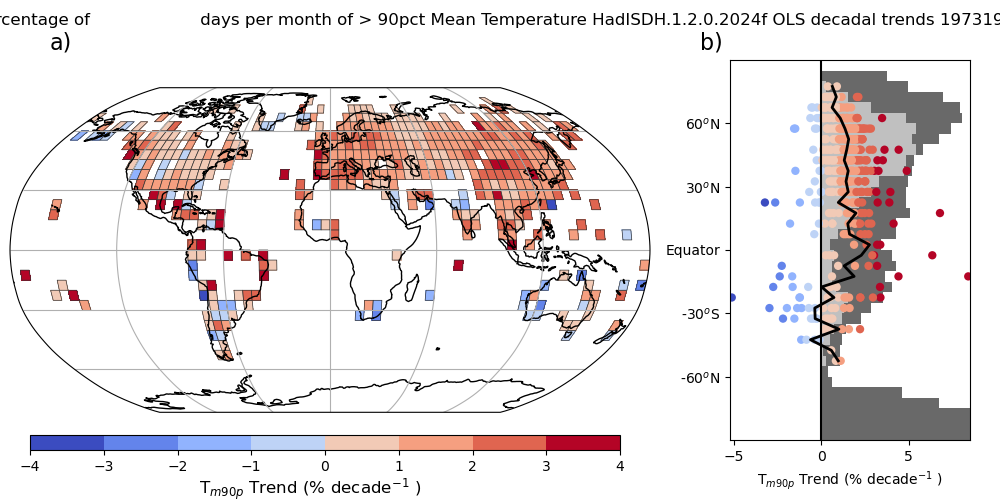
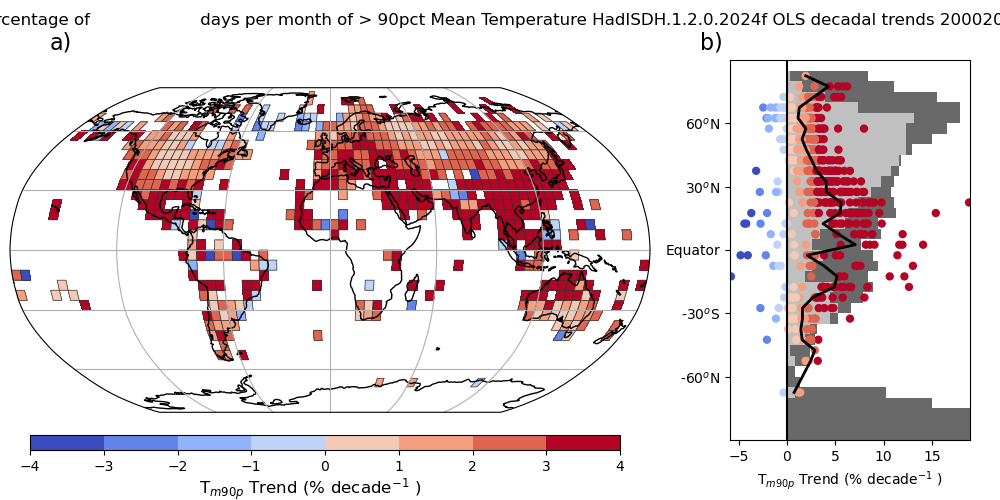
Percentage of days per month exceeding 90th percentile of climatological daily mean dry bulb temperature (TM90p) anomaly (1991-2020)
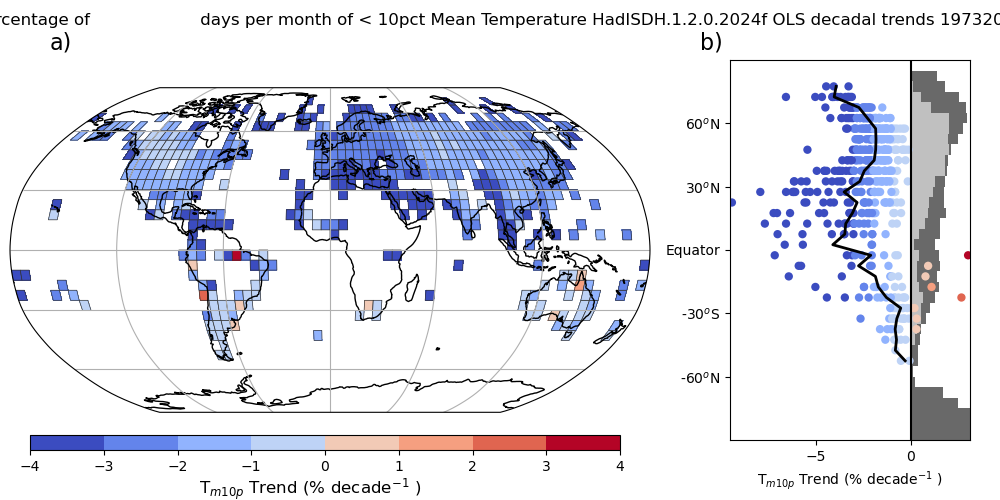
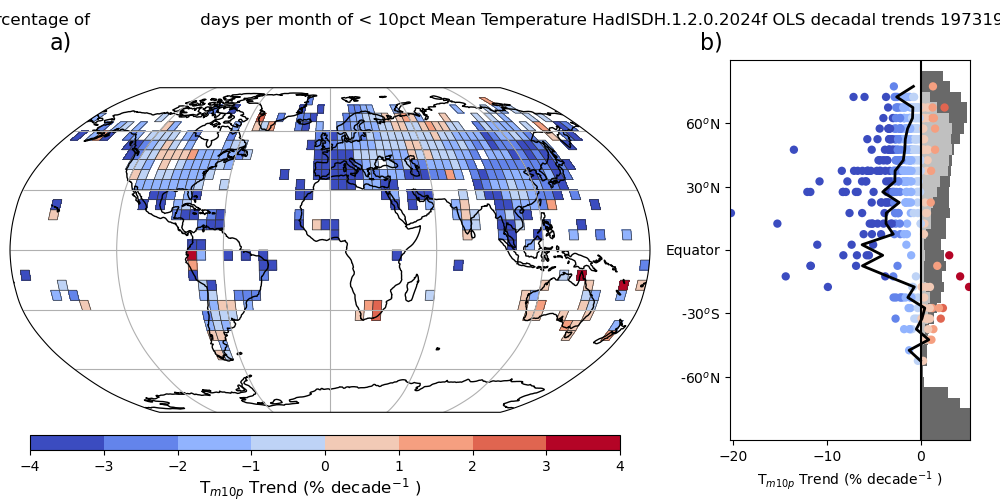
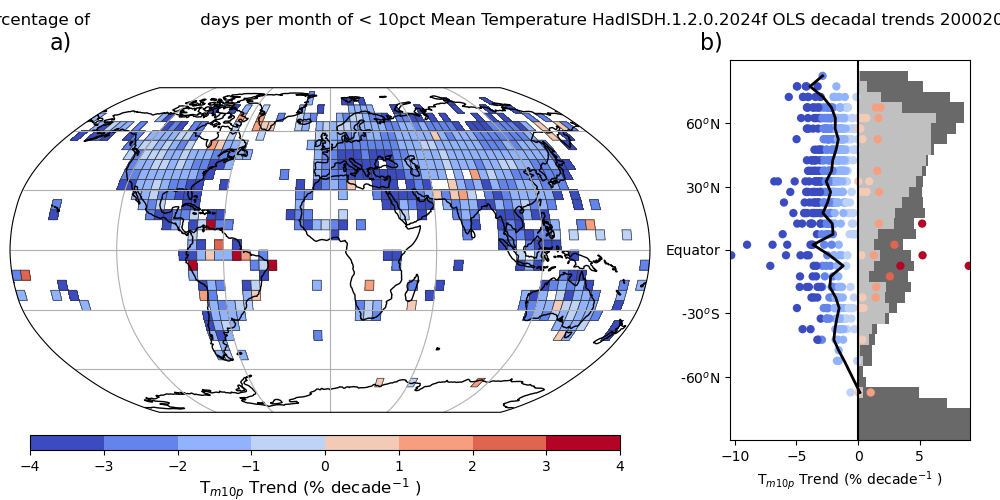
Percentage of days per month exceeding 10th percentile of climatological daily mean dry bulb temperature (TM10p) anomaly (1991-2020)
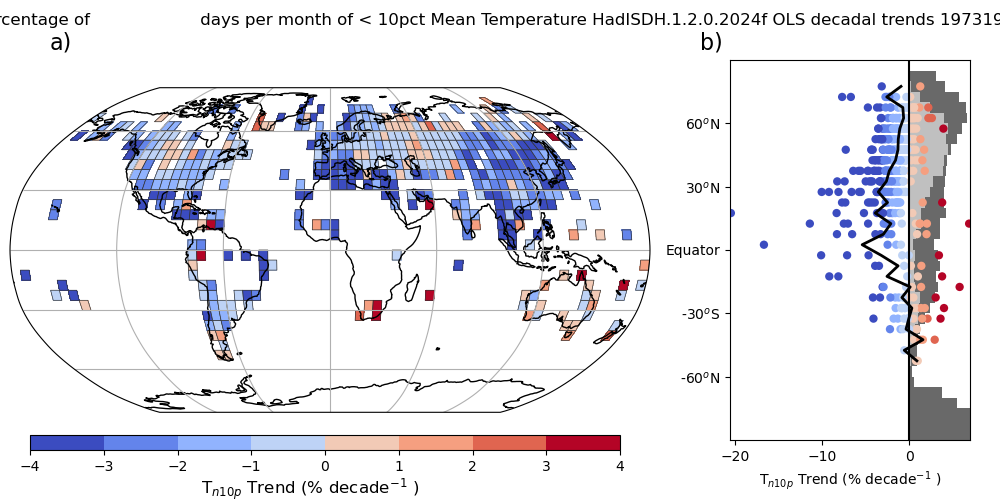
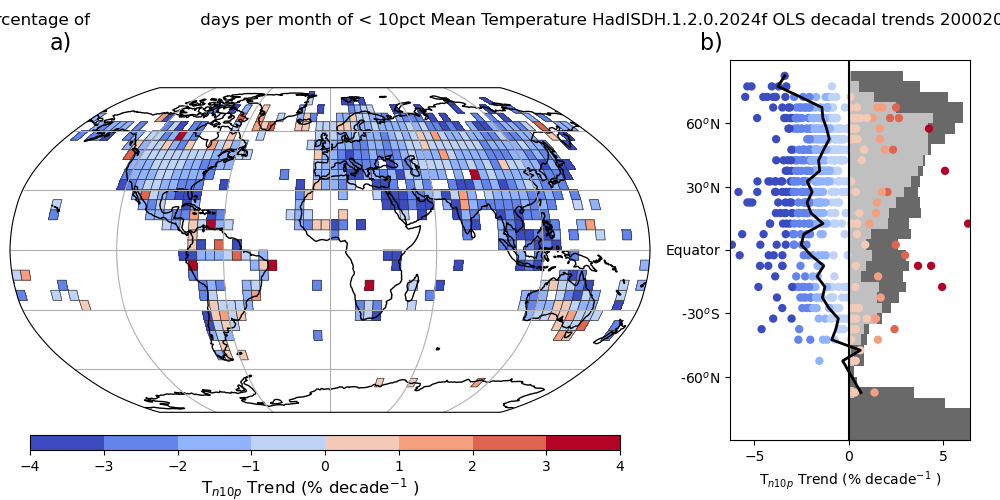
Percentage of days per month exceeding 10th percentile of climatological daily minimum dry bulb temperature (TN10p) anomaly (1991-2020)

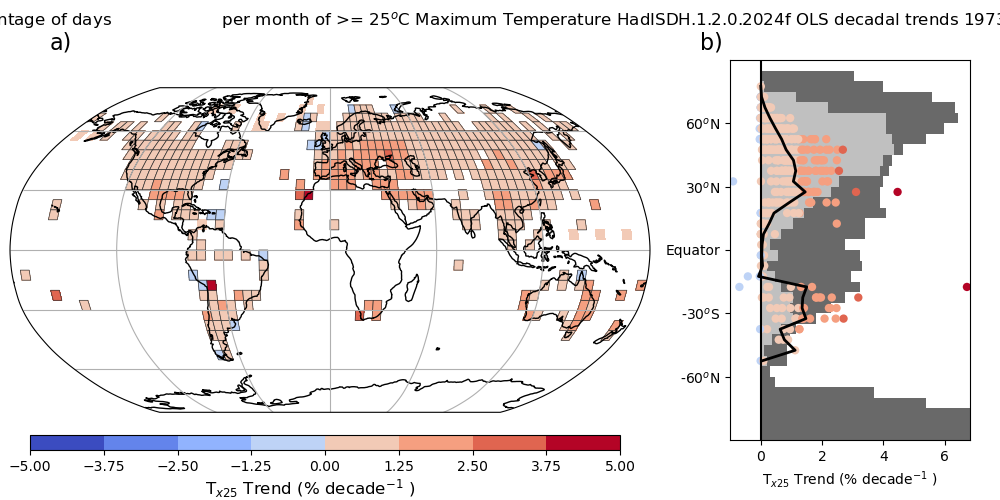
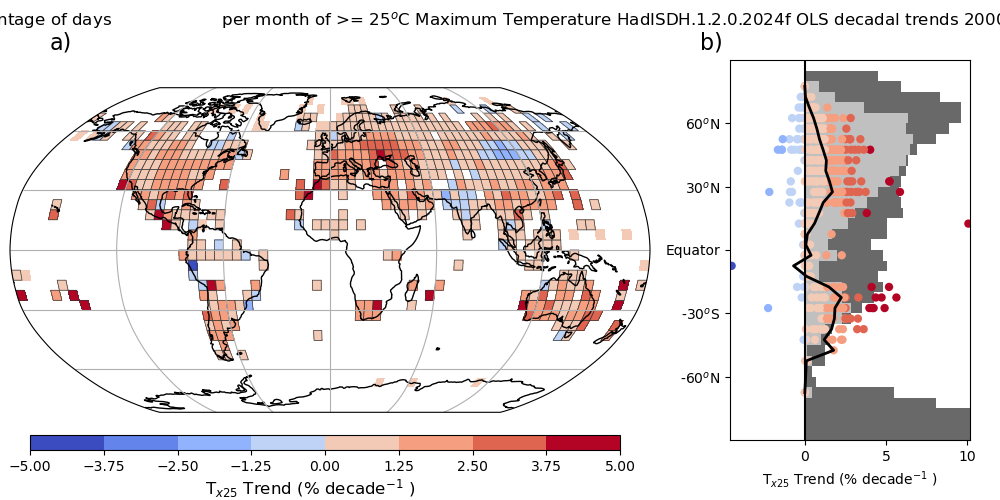
Percentage of days per month equal or exceeding 25 °C maximum dry bulb temperature (TX25) anomaly (1991-2020)

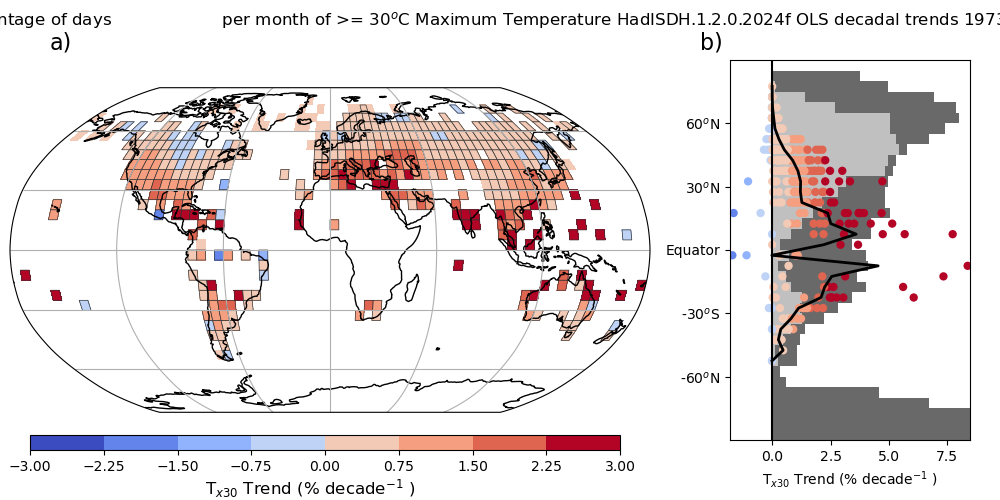
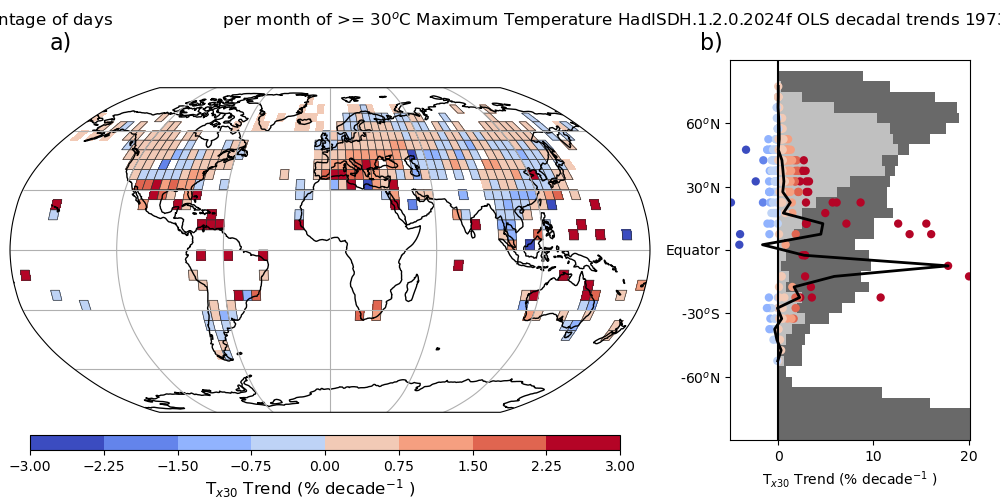
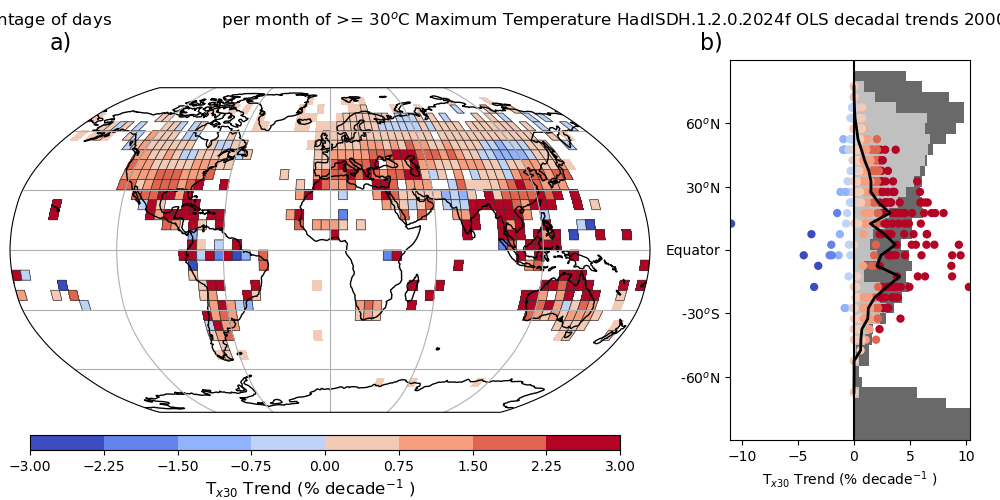
Percentage of days per month equal or exceeding 30 °C maximum dry bulb temperature (TX30) anomaly (1991-2020)
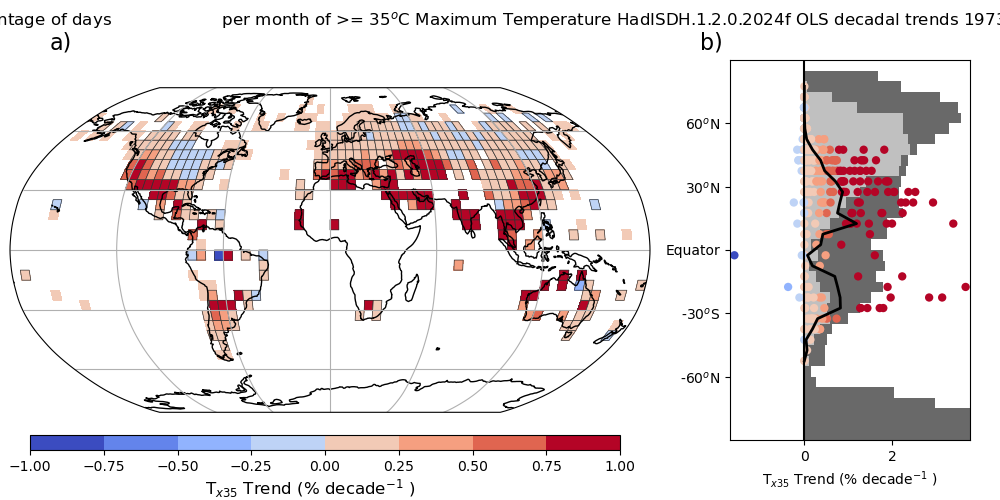
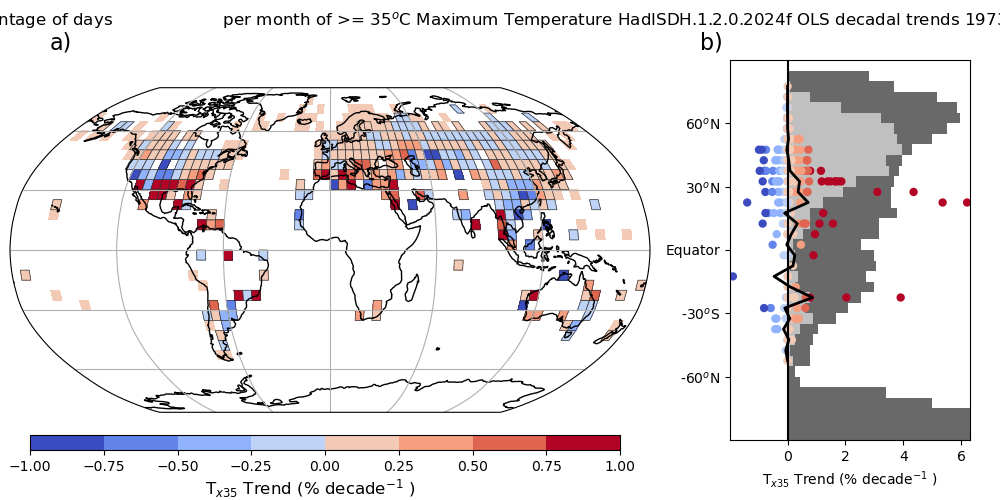
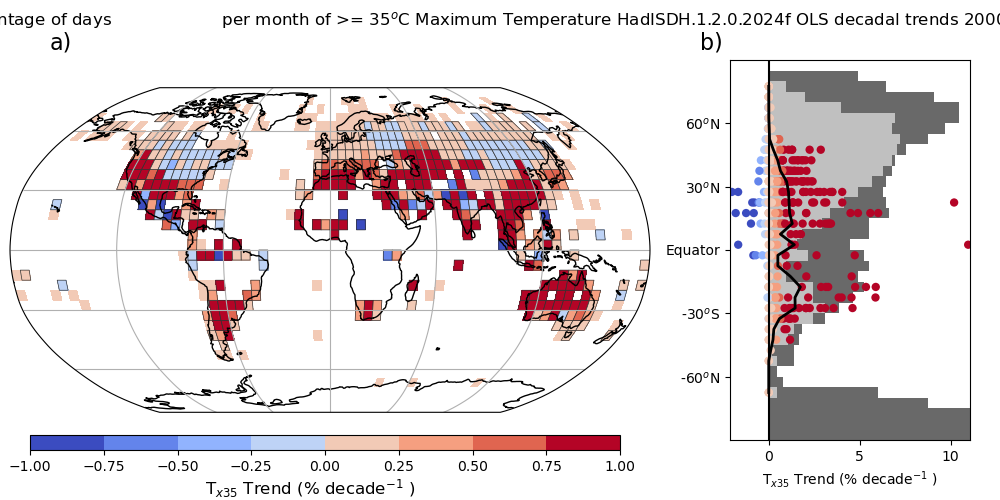
Percentage of days per month equal or exceeding 35 °C maximum dry bulb temperature (TX35) anomaly (1991-2020)
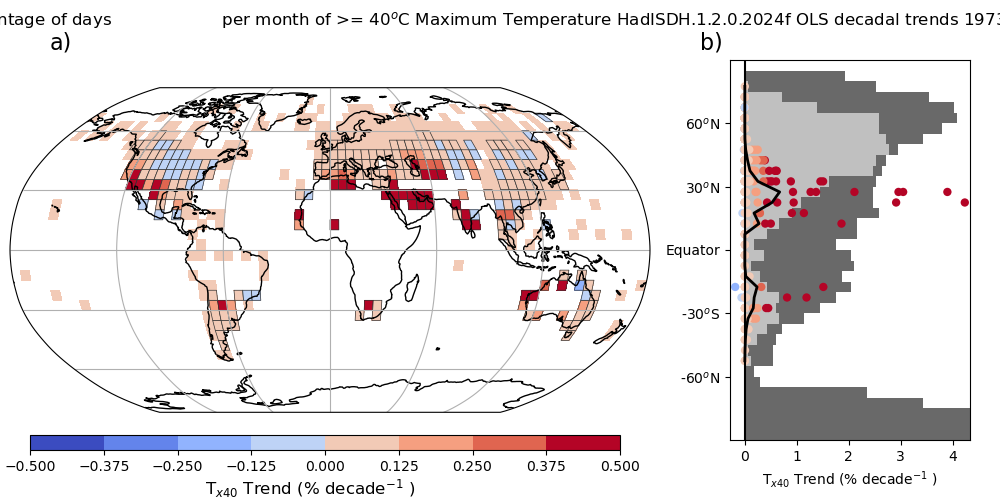
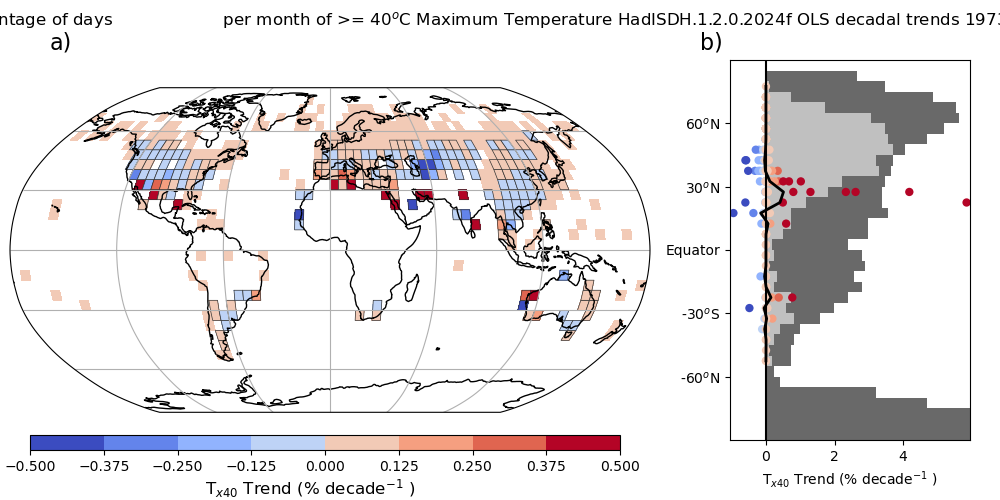
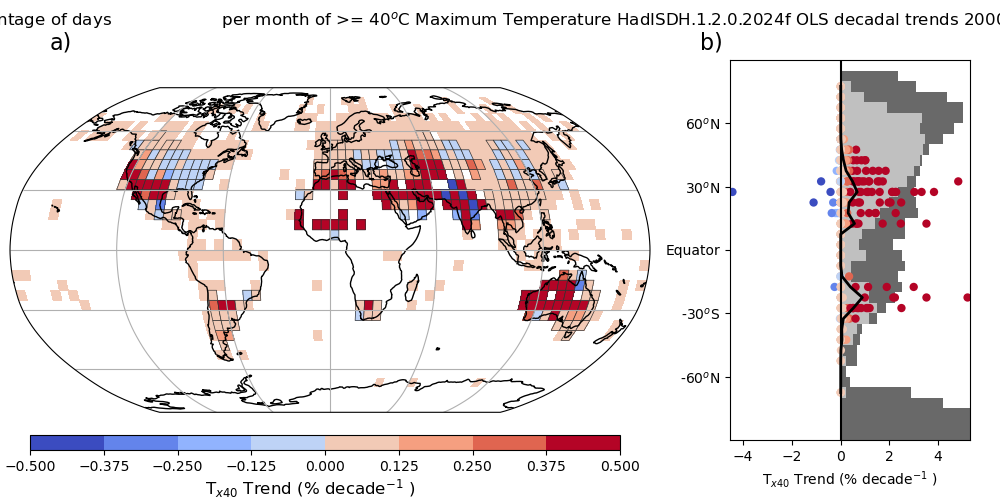
Percentage of days per month equal or exceeding 40 °C maximum dry bulb temperature (TX40) anomaly (1991-2020)
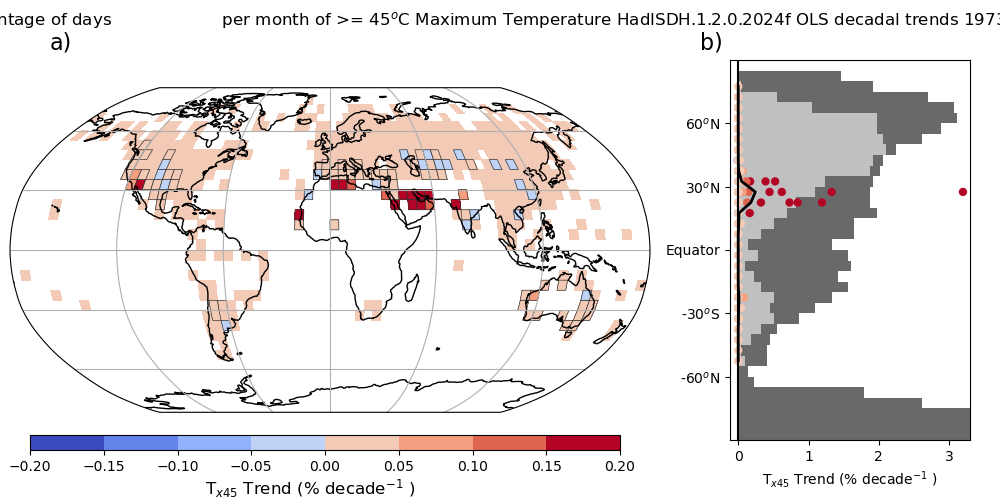
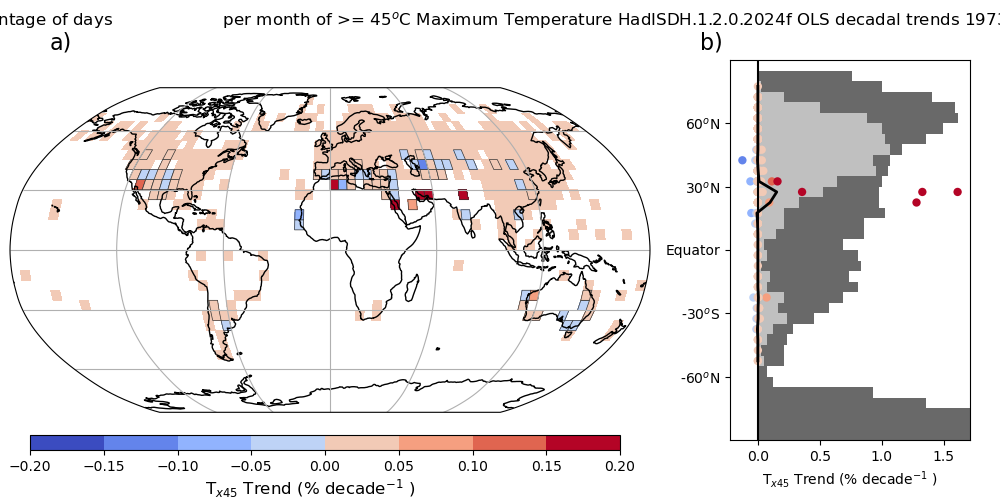
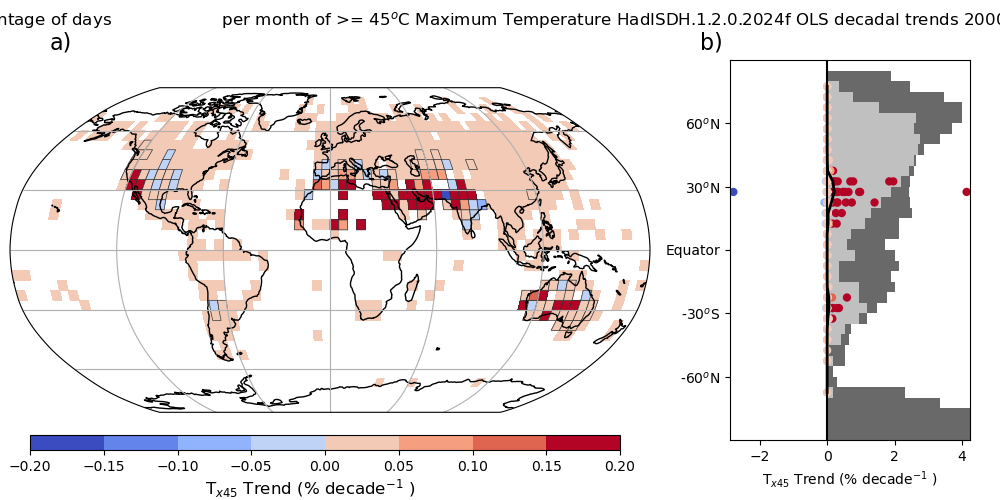
Percentage of days per month equal or exceeding 45 °C maximum dry bulb temperature (TX45) anomaly (1991-2020)
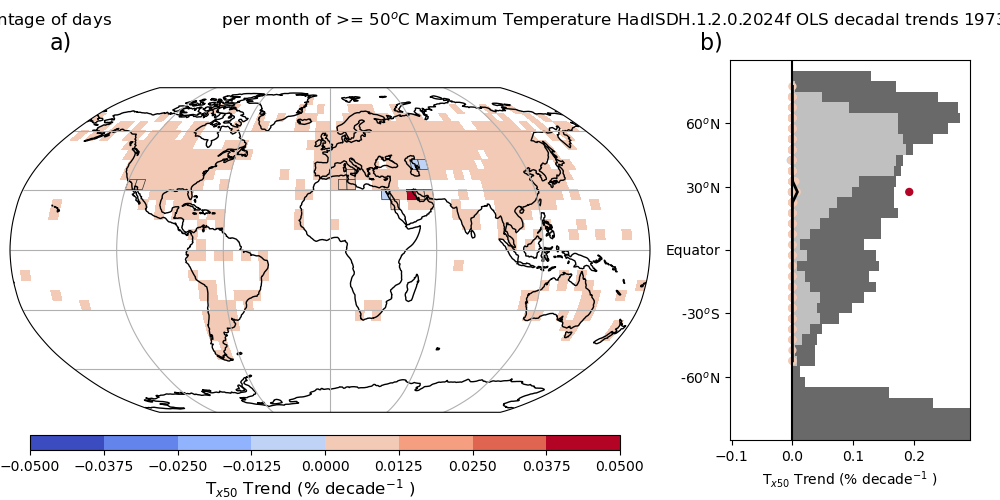
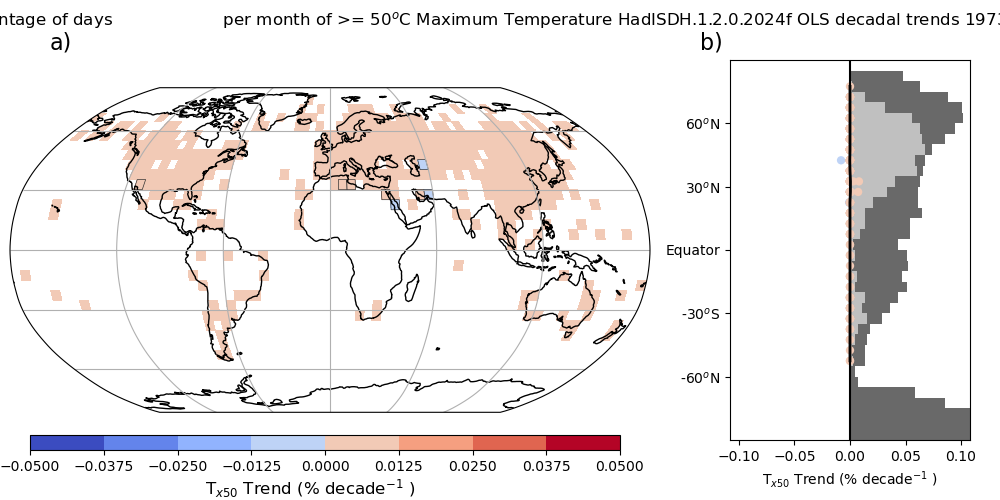
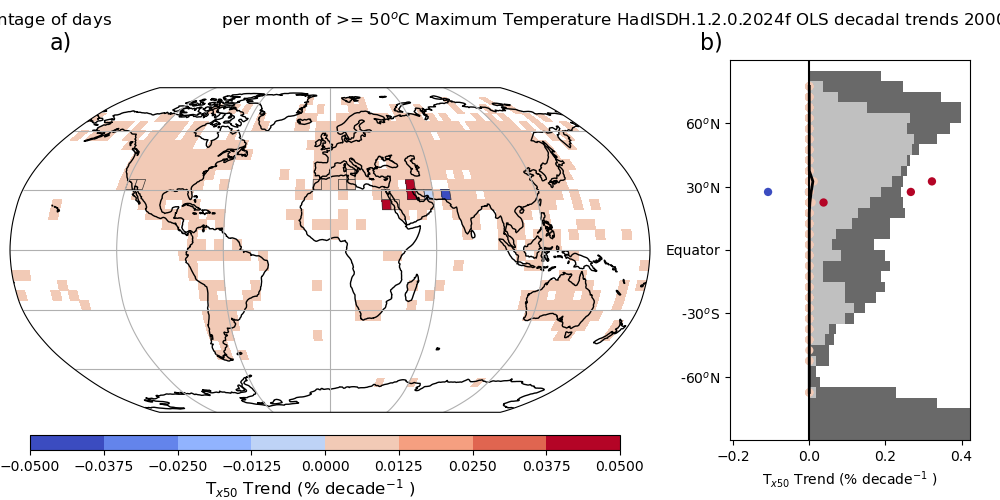
Percentage of days per month equal or exceeding 50 °C maximum dry bulb temperature (TX50) anomaly (1991-2020)