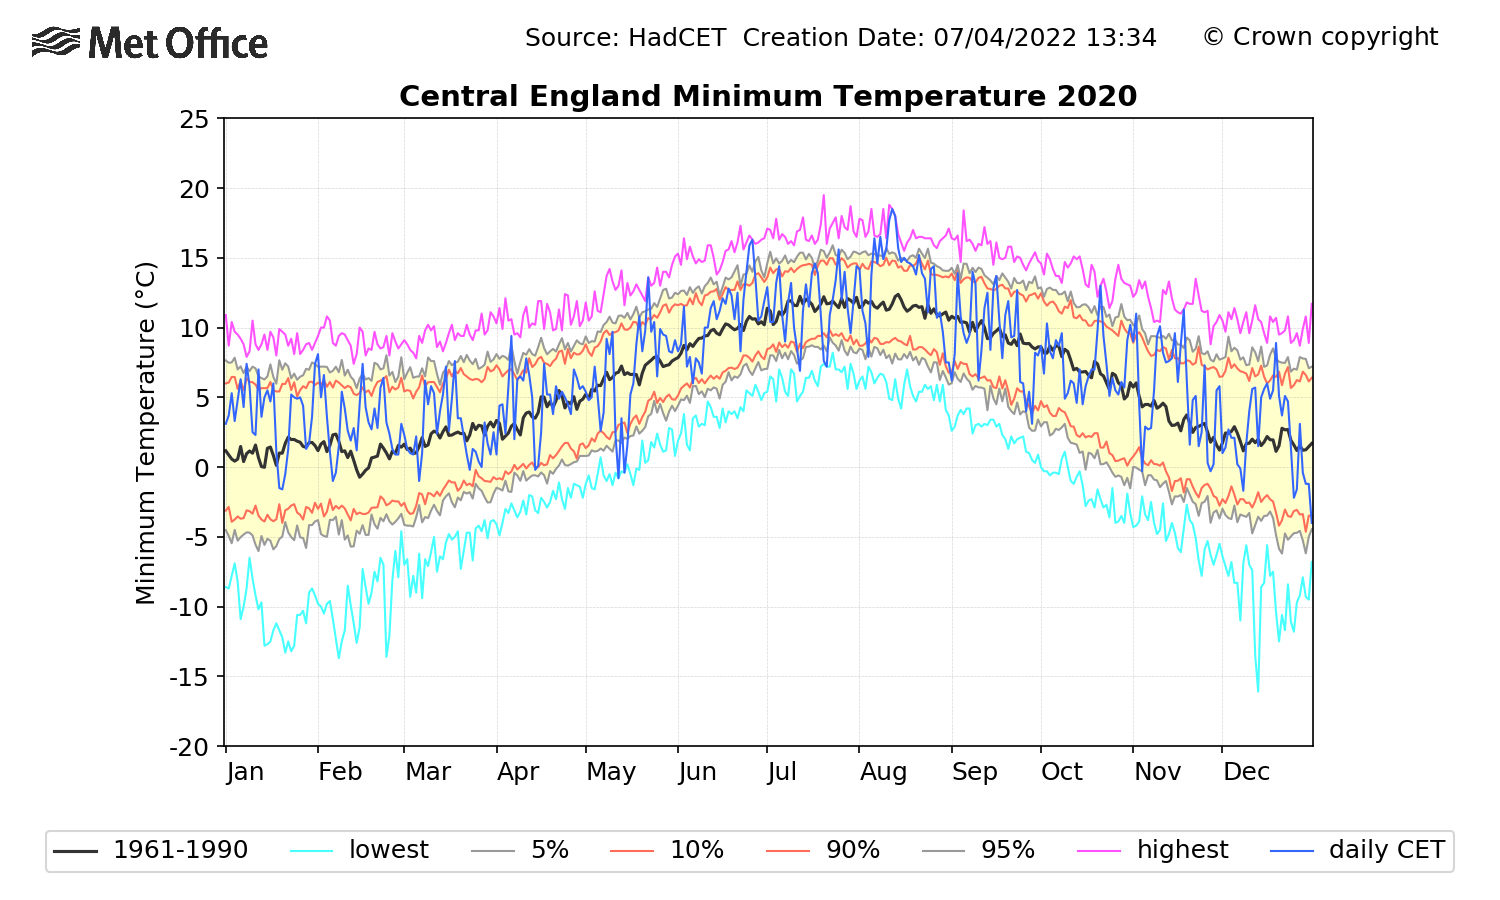
| Month | CET | Anomaly | notes |
| January | 3.9 | 2.7 | |
| February | 3.4 | 2.4 | |
| March | 2.9 | 0.6 | |
| April | 5.0 | 1.1 | |
| May | 6.9 | 0.1 | |
| June | 10.8 | 1.2 | |
| July | 11.7 | 0.1 | |
| August | 13.6 | 2.2 | |
| September | 9.4 | -0.2 | |
| October | 7.4 | 0.3 | |
| November | 5.5 | 2.0 | |
| December | 2.5 | 0.6 |
Average for 2020: 6.93, anomaly: 1.08C
Daily CET graph
