Met Office Hadley Centre observations datasets
Home > HadSST2 > Diagnostics >

HadSST2 Maps

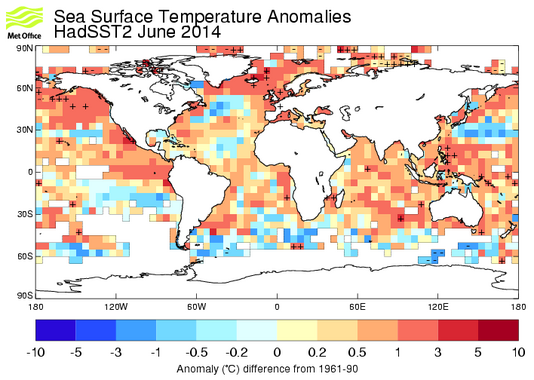
HadSST2 anomalies map for lastest month

Map of monthly average Sea surface temperature (SST) anomalies (relative to 1961-1990) from HadSST2. White areas represent gridboxes containing no SST data. The black crosses and dashes indicate that a pixel is, respectively, the warmest or coldest example of that calendar month in the record.
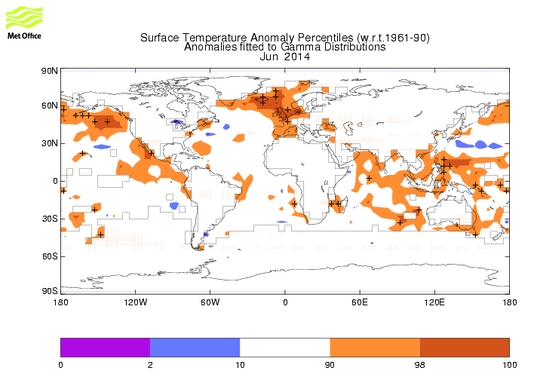
HadSST2 map for lastest month percentiles relative to 1961-90

Map of sea surface temperature (SST) anomalies (relative to 1961-1990) expressed as percentiles of a modified 2-parameter gamma distribution. The black crosses and dashes indicate that a pixel is, respectively, the warmest or coldest example of that calendar month in the record. Coloured areas are significantly warm (orange and red) or cool (blue and magenta).

Commercial and media enquiries

You can access the Met Office Customer Centre, any time of the day or night by phone, fax or e-mail. Trained staff will help you find the information or products that are right for you.
Contact the Met Office Customer Centre